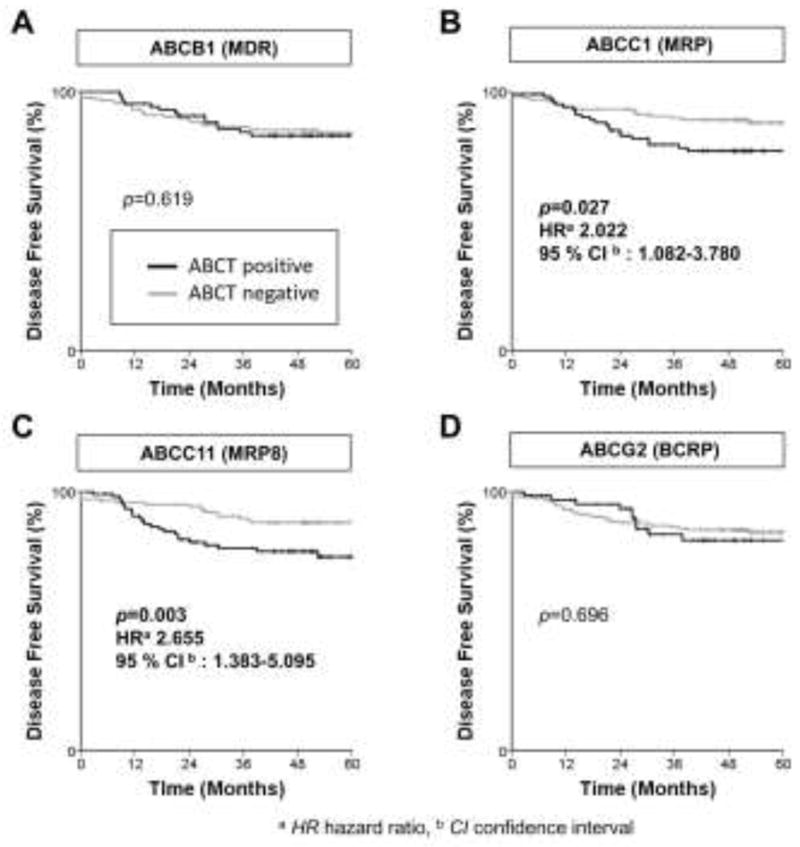
Fig. 2.

Kaplan–Meier disease-free survival curves according to expression of ABCB1 (A), ABCC1 (B), ABCC11 (C), and ABCG2 (D). The thick bold line indicates positivity; and the light gray line indicates negativity, for the respective transporters. Only the ABCC1+ and ABCC11+ groups showed significantly improved survival (P = 0.025 and P = 0.005, respectively).
