
Fig. 4.
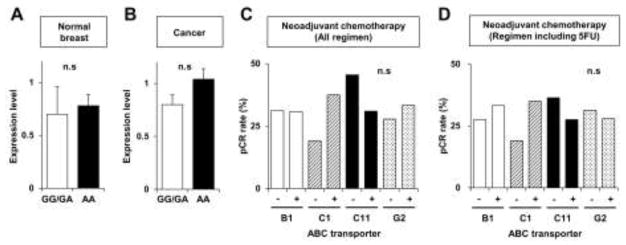
Semi-quantification of ABCC11 expression levels in normal breast tissue (A) and cancer tissue (B) in patients carrying 538G/G, 538G/A (white open column, GG/GA, wet earwax phenotype), and 538A/A alleles (black filled column, AA, dry earwax phenotype). (C, D) Pathological complete response ratios to neoadjuvant chemotherapy of all regimens (C) and regimens including 5-FU (D). Bars indicate ABCB1 (white columns), ABCC1 (hatched columns), ABCC11 (black columns), and ABCG2 (dotted columns).