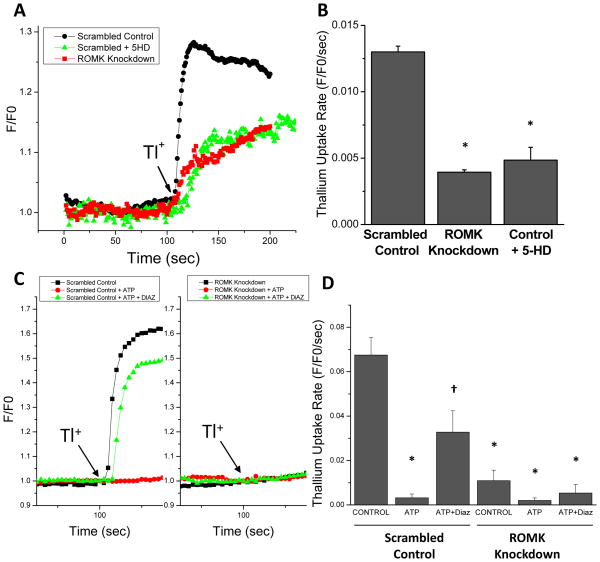
Figure 4. Suppression of mitochondrial thallium uptake by ROMK knockdown.
A) H9C2 cells were permeabilized with digitonin and mitochondrial thallium uptake (2 mmol/L; ATP-free), was determined as the initial rate of change in fluorescence intensity, normalized to the baseline K+- and Tl+- free fluorescence, of a mitochondrial matrix-localized thallium-binding reporter, BTC-AM (F/F0). Three cell populations were examined: i) a stable cell line expressing scrambled control shRNA, ii) the same control cells treated with 500 μM 5-HD, and iii) a stable cell line expressing ROMK shRNA. B) Summary of initial thallium uptake rates for each group (n=3 experiments). * denotes statistically significant differences between control and TPNQ treated samples (p<0.05). C) Thallium uptake in the presence of (i) 1 mmol/L ATP and (ii) 1 mmol/L ATP with 10μM diazoxide in permeabilized H9C2 cells pre-loaded with Fluozin-2 indicator (Left panel: control cells; Right panel: ROMK knockdown cells). D) Summary of initial thallium uptake rates for each group (n=3 for each group other than control cells with ATP [n=4] and knockdown cells with ATP [n=5]). Statistically significant differences were determined by 2-way ANOVA followed by Tukey’s test (p<0.05): * denotes a significant difference compared to scrambled control cells alone; † difference compared to scrambled control cells with ATP.

