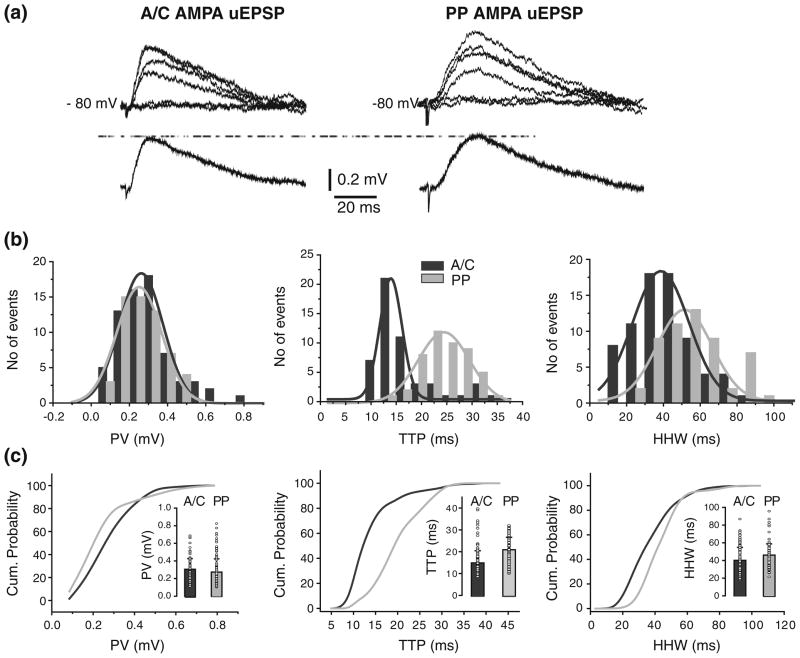
Fig 5.
Location-independence of somatic A/C and PP AMPA uEPSP amplitudes. (a) AMPA uEPSP from A/C (left) and PP (right), with corresponding averages underneath. Failures are also depicted but not averaged. (b) Peak amplitude (left), TTP (center) and HHW (right) histograms for A/C AMPA uEPSPs (black), and for PP AMPA uEPSPs (gray) in one cell. Histograms do not include failures. (c) Comparison of cumulative probability distributions for PV (left), TTP (center), and HHW (right) from A/C (black) and PP (gray) AMPA uEPSPs. Insets: Mean and s.d. of the unitary values (circle) for PV (left), TTP (center), and HHW (right). A significant difference was found in TTP (p<0.001), but not in PV or HHW, between AMPA uEPSC from A/C vs. PP

