Figure 5.

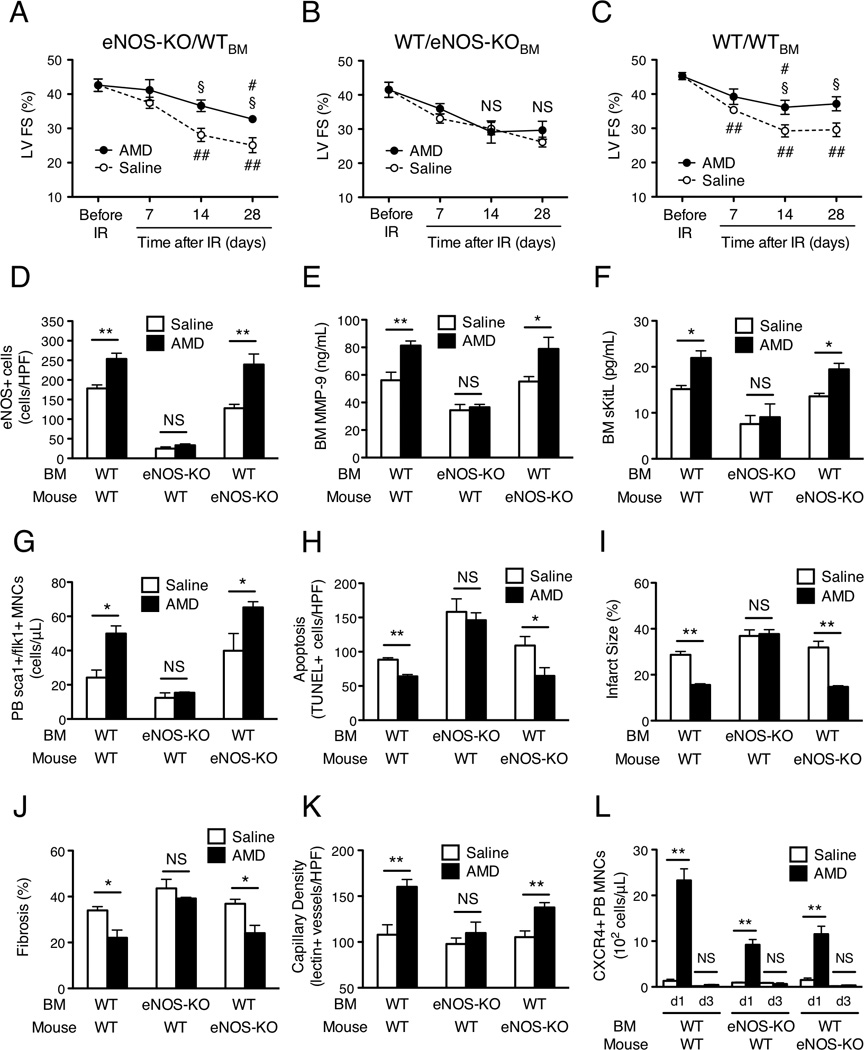
The benefit of AMD3100 treatment after IR injury is dependent on eNOS expression in the bone marrow but not in the ischemic tissue. AMD3100 or saline was subcutaneously injected after IR injury in eNOS-knockout mice that had been transplanted with BM from WT mice (eNOS-KO/WTBM), in WT mice transplanted with BM from eNOS-KO mice (WT/eNOS-KOBM), and in WT mice transplanted with WT BM (WT/WTBM). (A–C) Echocardiographic assessments of LV fractional shortening (FS) were performed before IR injury and 7–28 days afterward. (D–F) BM was harvested 3 days after IR injury. (D) BM cells were labeled with fluorescent anti-eNOS antibodies, and positively stained cells were quantified. (E, F) BM plasma levels of (E) MMP-9 and (F) sKitL protein were determined via ELISA. (G) Three days after IR injury, MNCs were isolated from the PB, labeled with fluorescent anti-Sca1 and anti-Flk1 antibodies, and the number of MNCs positive for both Sca1 and Flk1 expression were determined via FACS. (H) Sections from the AAR of mice sacrificed on day 3 after IR injury were TUNEL stained, and apoptosis was quantified as the number of positively stained cells. (I) Infarct size and AAR were assessed via in-vivo microsphere perfusion and TTC staining in mice sacrificed on day 3 after IR injury; the ratio of the area of the infarct to the AAR was presented as a percentage. (J) Fibrosis on day 28 after IR injury was assessed in Masson-trichrome–stained heart sections, quantified as the ratio of the length of fibrosis to the LV circumference, and presented as a percentage. (K) Capillary density was assessed in mice that had been perfused with BS1-lectin before sacrifice on day 28 after IR injury and quantified as the number of lectin+ vascular structures. (L) MNCs were harvested from the PB on day 1 (d1) and day 3 (d3) after IR injury, labeled with fluorescent anti-CXCR4 antibodies, and the number of CXCR4+ MNCs was determined via FACS. ## Bonferroni-adjusted P<0.01 versus before injection; §Bonferroni-adjusted P<0.05, *P<0.05 and **P<0.01 versus saline; NS, not significant. Panels A–C: n=4–8 per treatment group at each time point; Panel D: n=3–4 per treatment group; Panel E: n=4–8 per treatment group; Panel F: n=5–9 per treatment group; Panels G–J: n=3–6 per treatment group; Panel K: n=3 per treatment group; Panel L: n=3–6 per treatment group at each time point. SEM is too small to be visible graphically for Panel C, Day 7 (saline)
