
Figure 5.
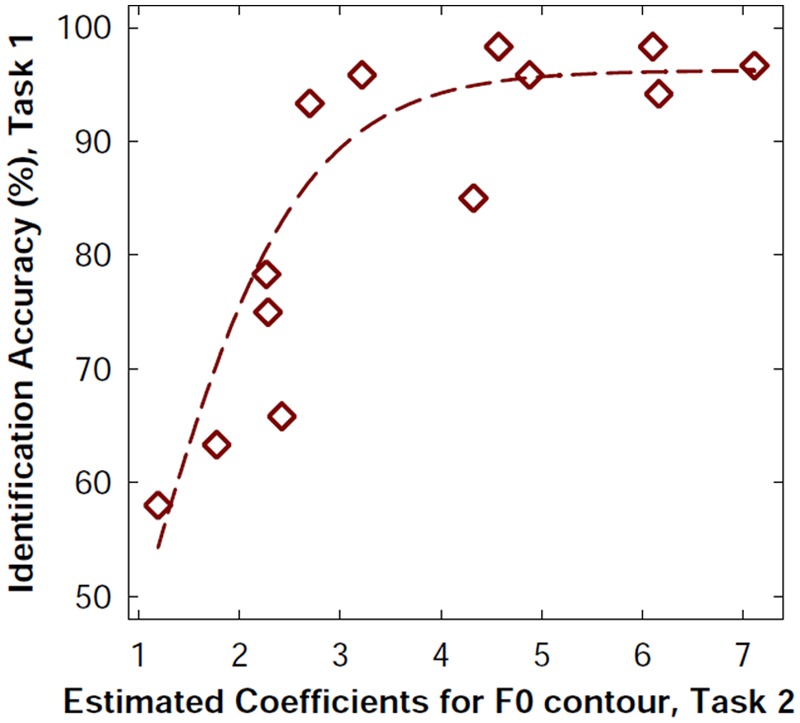
Relationship between CI listeners’ question-statement identification accuracy using naturally uttered stimuli and the estimated coefficient for F0 contour. The x-axis displays the estimated coefficient, as revealed from Task 2, while the y-axis displays the overall identification accuracy, as revealed from Task 1. The dotted line represents the regression line fitted to all data points (r2 = .8472, p < .001).