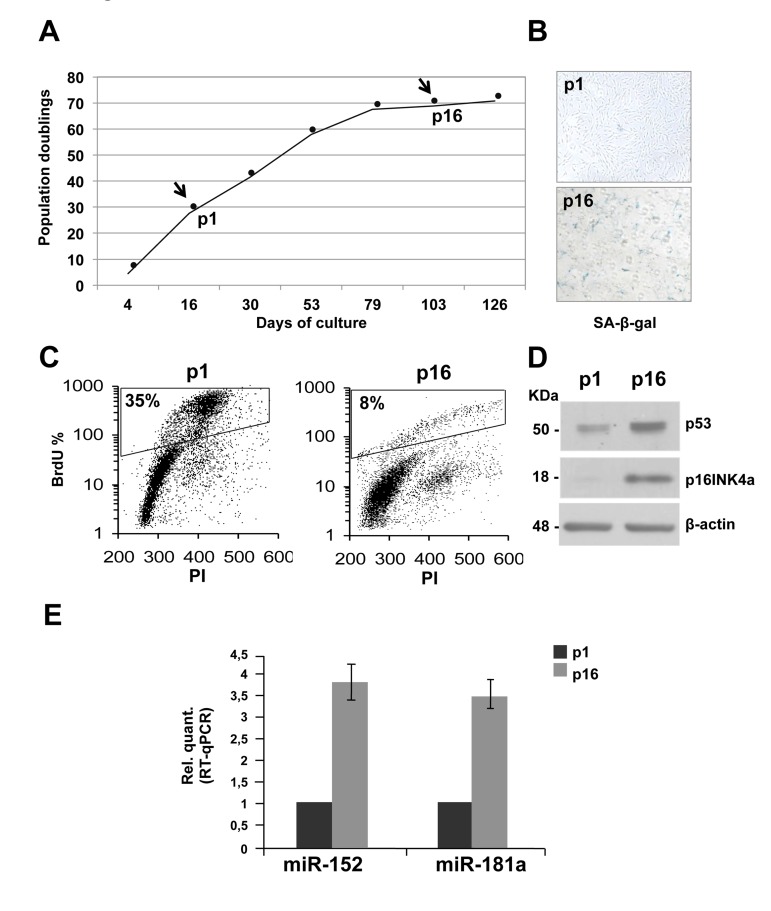
Figure 1. Replicative senescence in human dermal fibroblasts (HDFn).
(A) Growth curve of cultured HDFn. (B) SA-β-gal staining of HDFn cells at p1 and p16 in culture. (C) HDFn cultured cells at p1 and p16 (p, passage) were subjected to a 4h BrdU-pulse, then collected, PI stained and analyzed by flow cytometry. BrdU positive cells are indicated as S phase fluorescent population and are assessed by PI staining of DNA content of 2n or 4n (fixed to values of 200 and 400 in the plots). (D) Western blots performed on proteins extracts from HDFn at p1 and p16 showing the analysis of some senescence markers, such as p53 and p16 levels. β-actin was used as loading control. (E) Real Time RT-qPCR was employed to analyze the expression levels of miR-152 and miR-181a in HDFn cells at a growing number of passages in culture (p1-p16). Values reported are the average ± SD of three independent experiments.

