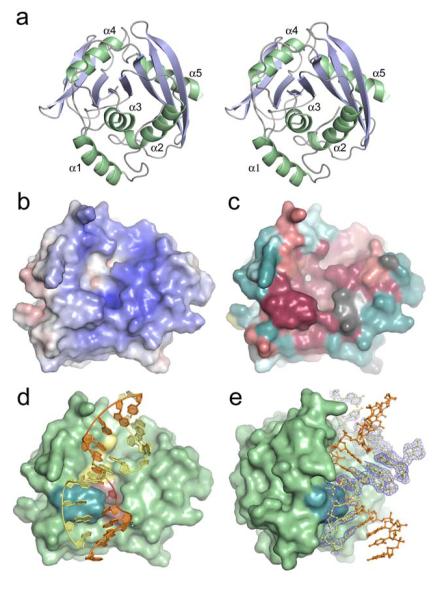
Figure 2.
EndoV overall fold, surface characteristics and protein-DNA complex structure. (a) Stereo pair showing protein fold and ternary structure of T. maritima EndoV. (b) Electrostatic potential of wild-type EndoV mapped onto the solvent accessible protein surface (blue positive regions, red negative regions). Electrostatic potential calculated using APBS. (c) Molecular surface showing conserved residues in the EndoV family [colored from dark burgundy (highly conserved) through neutral grey into dark cyan (highly variable)]. Degree of conservation calculated using ConSeq (http://conseq.tau.ac.il/). (d) Molecular surface with bound DNA (orange and yellow tubes and spheres) showing spatial relationships among key structural elements: the strand-separating PYIP wedge (cyan, left) protrudes out adjacent to residues Asp43, Glu89, Asp110, His214 involved in Mg2+ ion binding and phosphodiester incision (yellow, center), as well as hypoxanthine lesion and surrounding residues (Leu85, Gly111, Gln112, Gly113, Gly136, Leu142) forming the nucleobase pocket (red, center). (e) Molecular surface of wild-type Tma EndoV showing substantial bending of the bound duplex DNA (orange and yellow ball-and-stick representation). PYIP-wedge shown in cyan. Experimental electron density is shown for one of the DNA strands in the duplex (σA-weighted 2Fo-Fc map contoured at 1σ).

