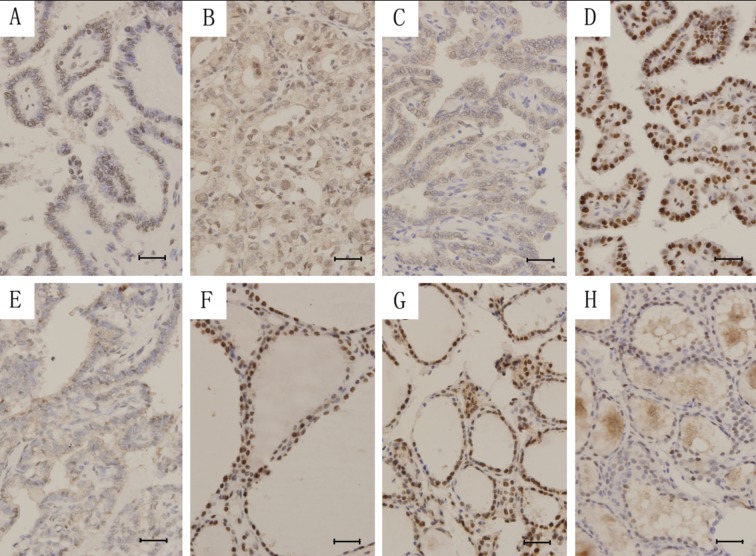
Figure 1.
The subcellular distribution of ERβ1 and ERβ2 in PTC and NTG. Nuclear (A), nucleocytoplasmic (B) and cytoplasmic (C) staining of ERβ1 and nuclear (D) and nucleocytoplasmic (E) staining of ERβ2 in PTC. Nuclear (F) and nucleocytoplasmic (G) staining of ERβ1 and nuclear (H) staining of ERβ2 in NTG. Scale bar =5 μm.

