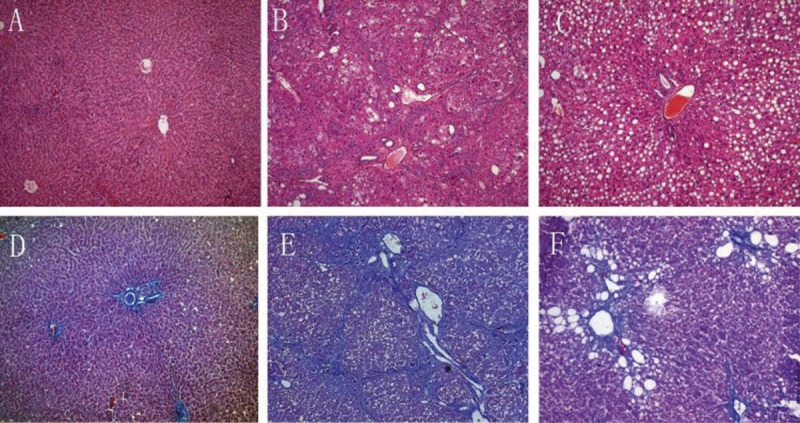
Figure 1.

Representative Light Photomicrographs of liver Tissue Showing Effects of 18αGL on Histological Changes (H&E and Masson Staining, Original Magnification 100). (A–C) represented H&E staining of the control group, liver fibrosis group, and high-dose 18αGL groups, respectively. (D,E) represented Masson staining of control group, liver fibrosis group, and high-dose 18αGL groups, respectively.
