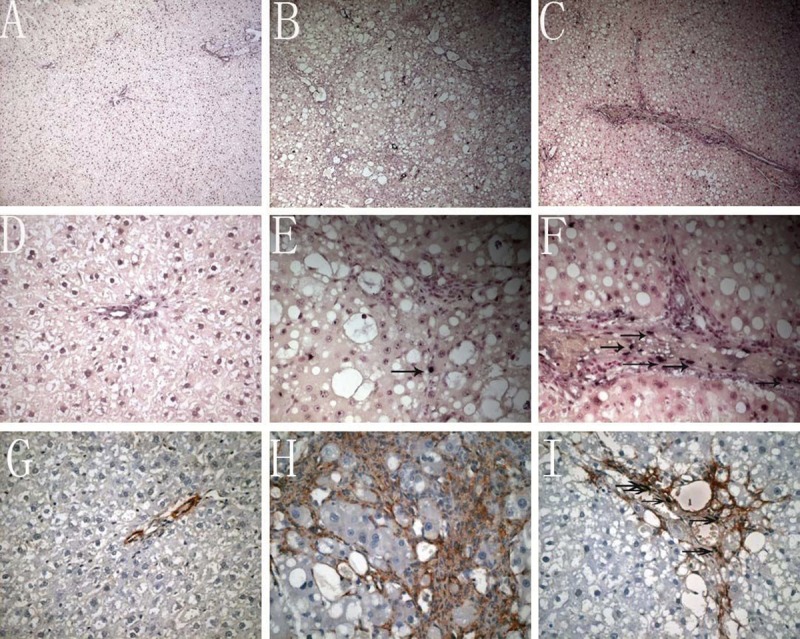
Figure 3.

Effects of 18αGL on apoptosis in Rats liver Tissues by TUNEL stained (the nucleus dark blue is positive Original Magnification 100 (A–C) 400 (D–F). Dual staining for a-SMA and TUNEL was undertaken in representative liver sections to localize apoptotic HSCs (Dark brownish stained positive apoptotic bodies with TUNEL reaction. Red stain signified the area of HSC. Co-localization of both stain represented apoptotic HSCs (original magnification 400 (G–I)). (A–C) represented TUNEL staining of control group, liver fibrosis group, and high-dose 18αGL groups, respectively. (D–F) are magnified image of (A–C), respectively (G–I). Dual staining for a-SMA and TUNEL of control group, liver fibrosis group, and high-dose 18αGL groups, respectively. Single arrow indicates apoptosis of HSCs.
