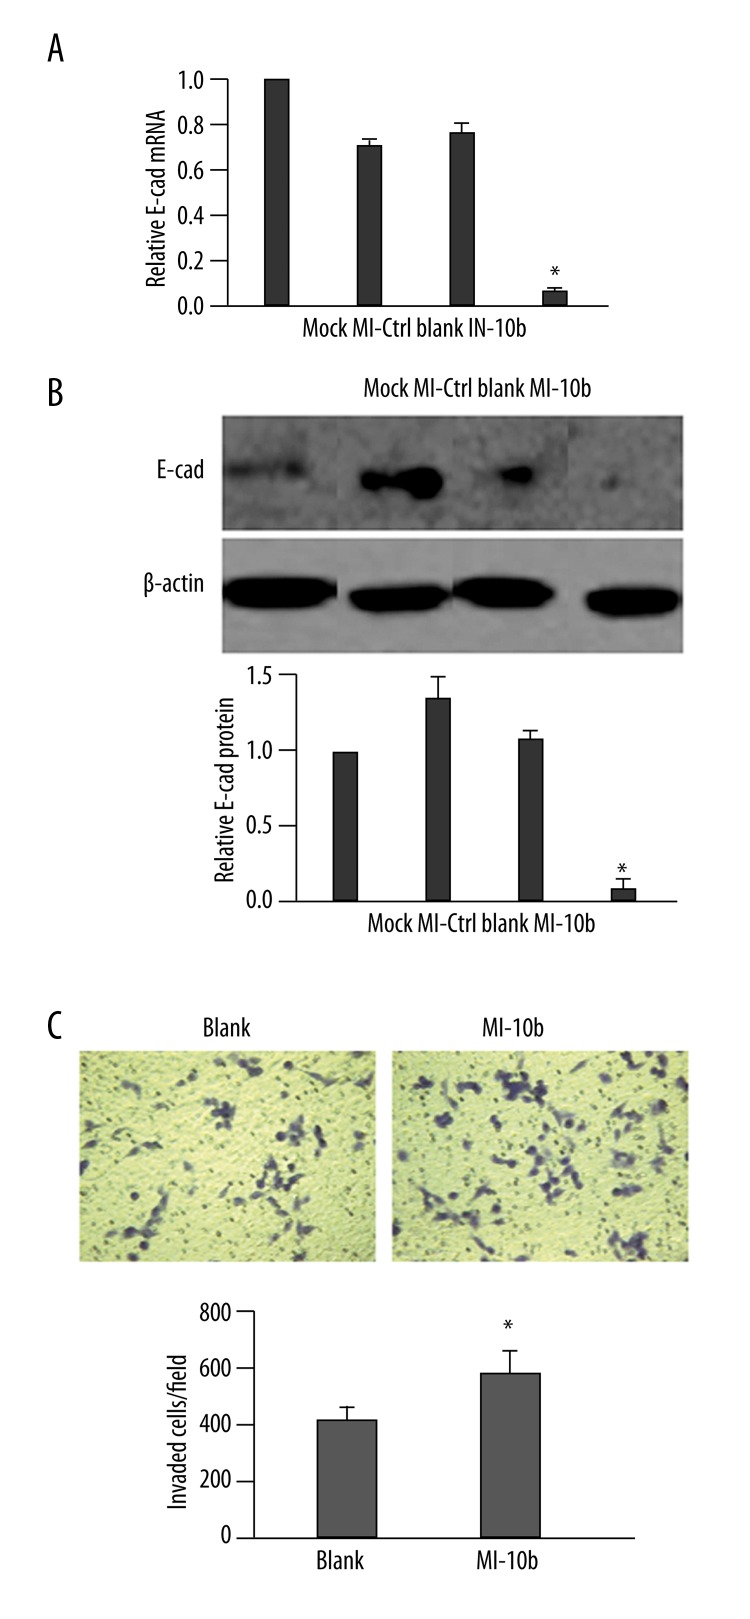
Figure 4.
Up-regulation of miR-10b level reduces the expression of E-cad. (A) MDA-MB-231 cells were transfected as indicated. The steady-state mRNA level of E-cad was determined 48 h later by RT-qPCR and presented as the ratio to GAPDH (internal control), with the relative level in Mock cells arbitrarily defined as 1.0. (B) MDA-MB-231 cells were treated as in (A), and the protein level of E-cad was examined by Western immunoblot. A representative gel image is shown (top), along with quantification of the ratio of E-cad to β-actin from three independent experiments (bottom). The level of relative E-cad expression in Mock cells was arbitrarily defined as 1.0. (C) At 48 h after transfection, the invasion capability of MDA-MB-231 cells was examined by Transwell assay. Representative images of invaded cells from each of the groups is presented (top). The number of invaded cells was calculated as the sum of crystal violet-positive cells from six random fields of each sample (bottom). * P<0.05, as compared to all other groups.

