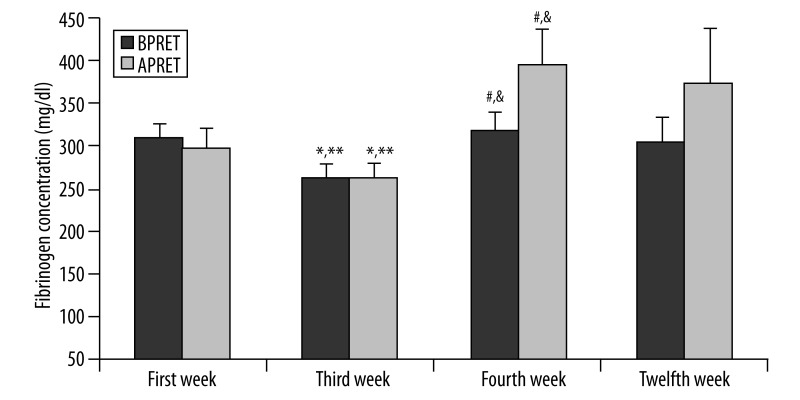
Figure 3.
Plasma fibrinogen concentrations of the subjects before and after progressive resistance exercise training (BPRET- APRET) on the first, third, fourth and twelfth week of the program. Values are expressed as mean ± SE. * p<0.01, difference from first week BPRET values; ** p<0.01, difference from first week APRET; #p<0.01, difference from third week BPRET values; &p<0.01, difference from third week APRET values.

