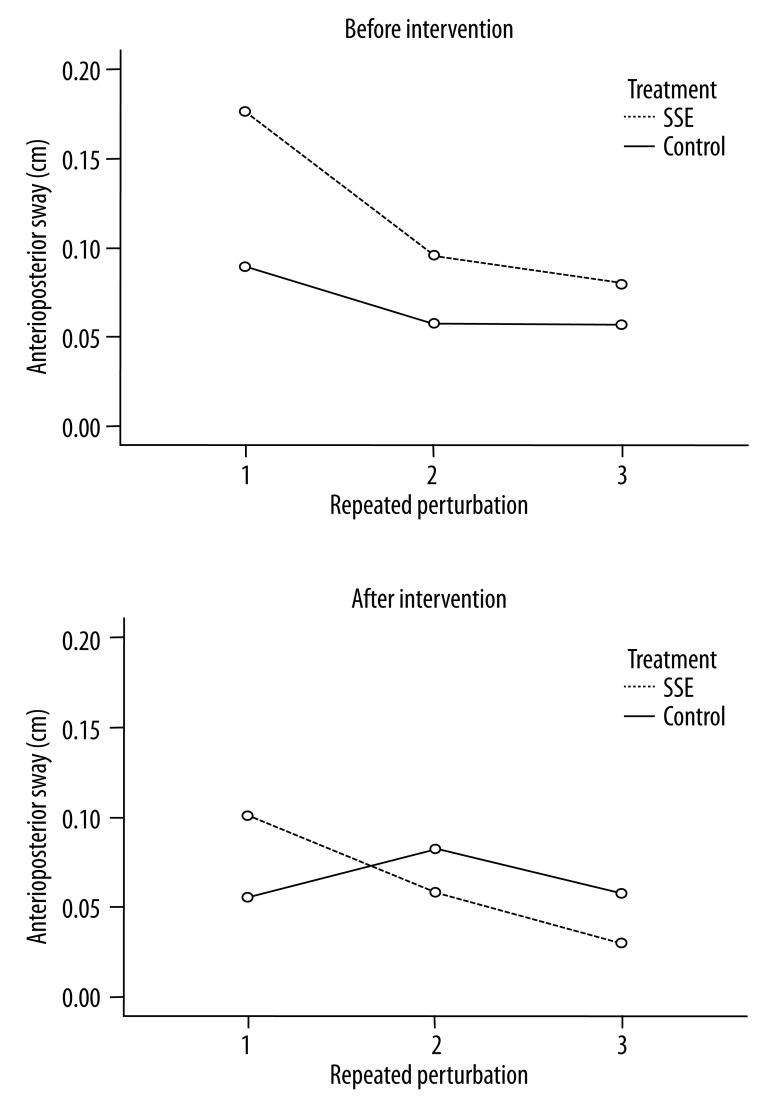
Figure 4.
The A/P displacement changes before and after intervention during repeated perturbations. The A/P sway changes in the group following SSE decreased compared to the control group over time, especially following the first perturbation. The pairwise comparison test indicated that the sway from the first perturbation significantly increased compared to the third perturbation.

