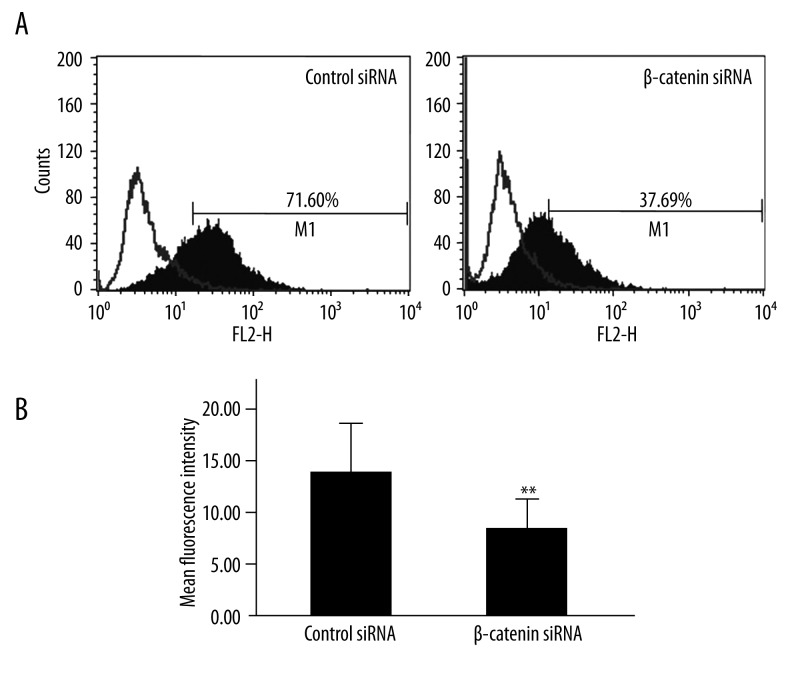
Figure 4.
(A) CD44v6 expression in LoVo cells following β-catenin siRNA transfection. The white histogram represents isotype control, and black histogram represents CD44v6 at 48 h after transfection. Depicted is the fluorescence intensity vs. cell count. (B) The mean fluorescence intensity of positive staining is shown. (** P<0.001 vs. scrambled siRNA, n=6)

