Summary
Background
Orthodontic force application to the teeth is responsible for a series of biological responses in the bone and dentin, which lead to some alterations of the mineral density of the tissues. Our objective was determine, through cone-beam computed tomography (CBCT), the mineral density of the apical third of the roots of the upper central incisors and of the periapical bone portion surrounding these teeth, in patients submitted to orthodontic treated and untreated individuals.
Material/Methods
30 untreated individuals and 15 treated ones (treatment cessation at least 1 year before the study) underwent CBCT. Mineral density was assessed in the apical third of the root of the upper central incisors and in the alveolar bone in the periapical region of these teeth. In order to reduce CBCT-related mineral density variability, we standardized the cone-beam tomography device, the image-acquisition settings and the field of view positioning and size. Student’s t test was used for the analyses.
Results
bone mineral density (BMD) and root mineral density (RMD), in Hounsfield Units, were 674.84 and 1282.26 for the untreated group and 630.28 and 1370.29 for the treated group, respectively. The differences between the group means were statistically significant for RMD (p<0.05).
Conclusions
untreated individuals had a significant lower mean RMD in comparison with those submitted to orthodontic treatment.
Keywords: bone density, cone-beam computed tomography, tooth movement
Background
Orthodontic force application to the teeth is responsible for a series of biological responses in the bone tissue, which lead to bone modeling and remodeling, allowing tooth movement [1]. The resulting neoformed bone has a low degree of mineralization [2,3], with short-term reduction of the mineral density of the tooth-surrounding alveolar bone [4], which may impair its structural resistance [5].
Besides causing obvious structural changes in the bone tissue, animal studies have shown orthodontic movement to have effects on the dental tissue, causing odontoblast activation [6] and increased dentin mineralization [6,7]. Such tissue reactions maybe due to the presence of specific proteins (dentin matrix protein 1 – DMP1, and dentin sialophosphoprotein - DSPP), which have their levels upregulated by mechanical stress [8,9]. Once such proteins are present in dentin and bone [8], mineralization of these 2 tissues may be likewise influenced by mechanical perturbations [7,10,11].
Alveolar bone mineral density is already associated with the formation of areas of hyalinization and root resorption units during orthodontic treatment [12,13]. Although this process might also be influenced by the degree of mineral density of the roots [14], there is a lack of studies investigating this issue.
Computed tomography (CT) and cone beam computed tomography (CBCT) scanners are the most frequently used instruments to assess the mineral density of craniofacial bone structures [4,15–19]. However, because the intensity values of CBCT images are influenced by the scanning device, image-acquisition settings and positioning [20], these variables should be controlled for in order to guarantee the reliability of the results.
The purpose of this controlled study was to assess the degree of mineral density of the apical third of the roots of upper central incisors and of the periapical bone, through CBCT images, comparing orthodontically treated and untreated subjects.
Material and Methods
Forty-five adult subjects were included in this study. They were consecutively selected from a postgraduate orthodontic program of the Juiz de Fora Federal University. They were divided into 2 groups: the untreated group (15 males, 15 females; mean age 23.1 years), which had not undergone orthodontic treatment; and the treated group (7 males, 8 females; mean age 22.8 years), which had finished their orthodontic treatment at least 1 year (mean time 6.52 years) prior to the study. All had full permanent dentition (with the exception of the 3rd molars) and no endodontic treatment in the teeth examined, root resorption, history of injury to the upper central incisors, or any kind of bone pathology.
This study was approved by the Human Research Ethics Committee of the Juiz de Fora Federal University.
Mineral density of the roots of the upper central incisors and the alveolar bone was calculated from CBCT images. The CBCT images were obtained with i-CAT (Imaging Sciences International Inc., Hatfield, USA), using a 160 mm diameter and 100 mm height field of view (FOV). The nominal beam was 120 kV and 3–8 mA, with 26.9 s rotation time. A voxel size of 0.4 mm was used. The individual’s head was aligned with a chin rest and laser lines, with the Frankfurt plane parallel to the floor and the median sagittal plane perpendicular to the floor. As for FOV positioning, the occlusal plane was positioned in its vertical center and the anterior nasal spine 35 mm from its anterior surface.
The images were analyzed with the i-CAT Vision (Imaging Sciences International Inc., Hatfield, USA) software, with 0.5 mm-thick slices. At MPR viewing modality, each upper central incisor was positioned vertically, so that the intersection of the sagittal and coronal sections coincided with its long central axis, with the coronal section parallel to the incisal border (Figure 1). In the sagittal section, the root length was measured as the distance between the most apical point of the root and the middle point of the vestibular and lingual cementum-enamel junctions.
Figure 1.
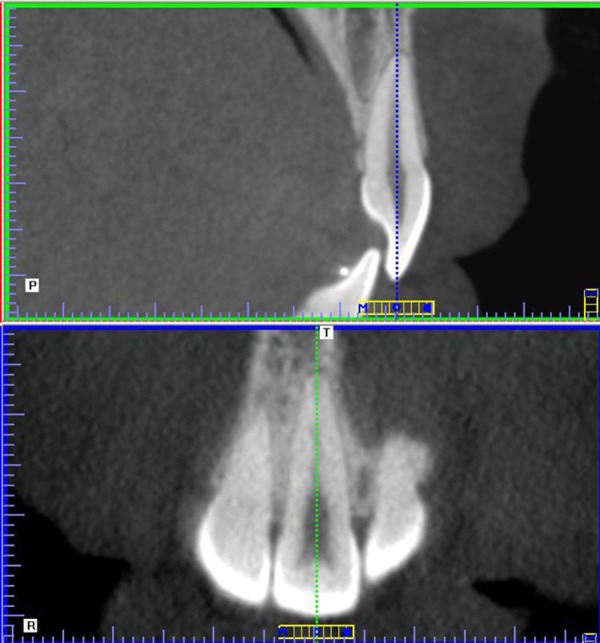
Sagittal and coronal sections of the upper central incisor.
One calibrated investigator (B.P.) randomly and blindly assessed the CBCT images of all patients, and determined the bone and root mineral densities.
Determination of the root mineral density (RMD)
The RMD was determined as the mean of 4 regions of interest (ROI) within the apical third of the roots, 2 areas in the coronal section (right and left – Figure 2) and 2 areas in the sagittal section (vestibular and lingual – Figure 3), encompassing as large an area as possible, but without impinging on the images corresponding to the periodontal ligament and the pulp. The areas in each section had the same dimensions.
Figure 2.
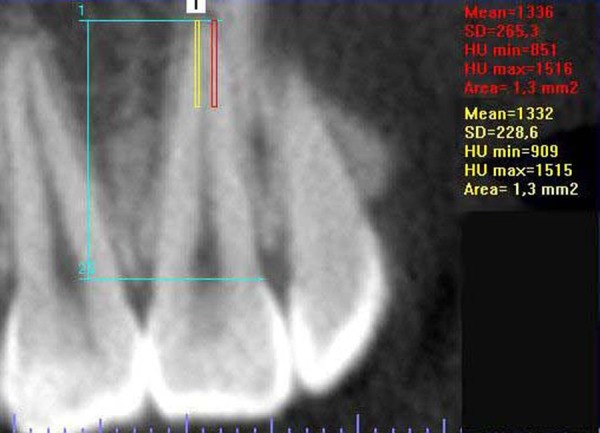
Outline of the areas in which the RMD was determined at coronal section.
Figure 3.
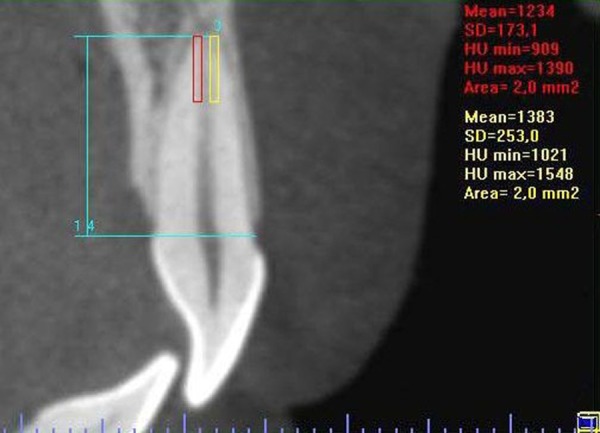
Outline of the areas in which the RMD was determined at sagittal section.
Determination of the alveolar bone mineral density (BMD)
BMD was determined in the same sagittal section used for RMD assessment for each tooth. BMD was determined as the mean density of 4 regions of interest (ROI) at the alveolar bone, 3 1×1 mm areas located on the lingual side of the apical third of the root (superior, middle and inferior) and another 1 mm-high supra-apical area, localized above the root apex, extending from the vestibular cortical wall to 2 mm lingual to the apex center (Figure 4).
Figure 4.
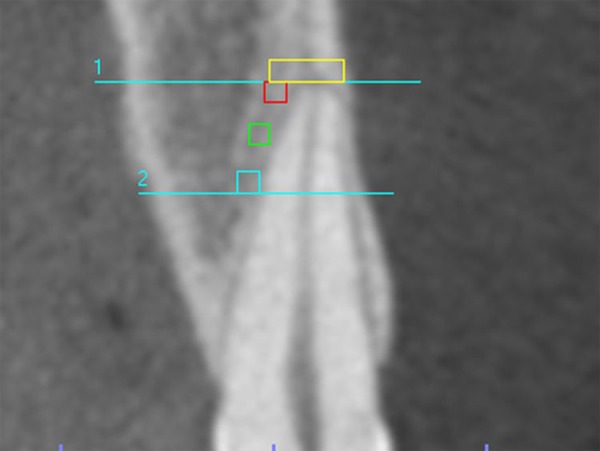
Sagittal section showing the apical and supra-apical areas, where the bone mineral density was determined.
Determination of reference areas
Although this was a controlled study, palatal bone areas were assessed in order to compare the MD of similar structures not affected by orthodontic movement, in both groups, as well as to assess the reliability of the measurements of symmetrical areas from the same individuals.
Likewise, the MD of bone areas not influenced by tooth movement or occlusal stress were assessed in order to compare similar structures of the 2 groups, as well as to assess the reliability of the measurements of symmetrical areas of the same individuals.
The BMD of 8 reference areas in the maxilla, 4 on each side, symmetrically positioned in the anteroposterior and mediolateral directions, was assessed. The maxilla was initially positioned with the axial and sagittal planes intersecting the anterior and posterior nasal spines. Afterwards, the lowermost axial section, where the posterior wall of the incisal foramen could be visualized, was selected. Coronal views of the maxilla were selected at 4 and 6 mm posterior to the distal wall of the incisal foramen, and the BMD was measured in 4 3 mm-wide areas in each coronal views, 1.5 and 4.5 mm lateral to the midline, on both sides (Figure 5). The upper and lower limits of the areas were defined by the cortical bone.
Figure 5.
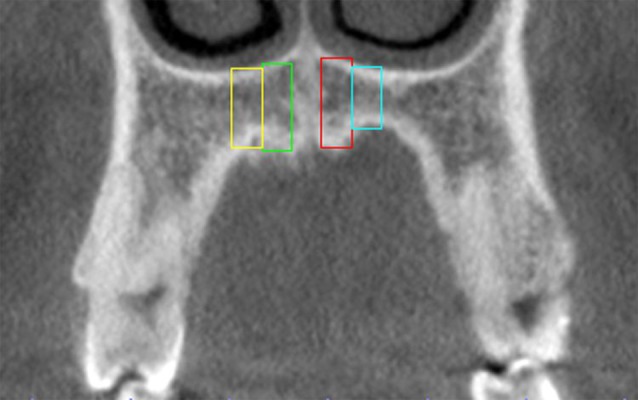
Coronal view of the references areas of maxilla.
Statistical analysis
Intra-rater agreement values of BMD of alveolar and reference areas and RMD measurements were examined by intraclass correlations (ICC), being based on 15 randomly chosen incisors, which were measured twice, with an interval of 15 days.
Due to the different size of the 2 groups, the normality of the variables was tested with the Shapiro-Wilks test for the treated group and with Kolmogorov-Smirnov test for the untreated group. All variables of the 2 groups exhibited a normal distribution. Additionally, the homoscedasticity of the variables was tested with Levene’s test for the treated and the untreated groups.
Comparison of the BMD values of reference and alveolar areas between left and right sides, for each group, was undertaken with Student’s dependent t test, the independent t test being used for between-group comparison. For RMD values, Student’s dependent t test was used to compare the left and right sides, the independent t test being used for between-group comparison. The Mann-Whitney test was used to confirm the results of the parametric test for between-group comparison.
The statistical analysis was made with α=.05 significance level and processed with SPSS Statistics 17.0.0 (SPSS Inc., Chicago, USA) software.
Results
Intra-rater agreement values of BMD (reference and alveolar areas) and RMD from the CBCT measurements were over 0.9, showing excellent agreement [21].
The BMD mean values of the reference areas of treated and untreated individuals, and the comparison between the right and left sides and between the groups, are shown in Table 1.
Table 1.
Mean values and comparison of reference areas between right and left sides and treated and untreated groups.
| Untreated (N = 30) | Treated (N = 15) | P (t-test) right | P (t-test) left | ||||||
|---|---|---|---|---|---|---|---|---|---|
| Right | Left | P (t-test) | Right | Left | P (t-test) | ||||
| 4 mm | 1.5 mm laterally | 622.6 (153.7) | 618.1 (147.1) | 0.793 | 583.8 (155.2) | 604.6 (133.1) | 0.463 | 0.430 | 0.766 |
| 4.5 mm laterally | 655.1 (151.6) | 640.3 (136.1) | 0.398 | 610.1 (203.1) | 633.4 (201.1) | 0.151 | 0.408 | 0.896 | |
| 6 mm | 1.5 mm laterally | 597.9 (179.1) | 636.4 (153.7) | 0.090 | 595.0 (179.8) | 603.2 (138.1) | 0.746 | 0.959 | 0.484 |
| 4.5 mm laterally | 650.9 (161.9) | 688.5 (163.1) | 0.010* | 633.2 (172.3) | 643.4 (124.7) | 0.792 | 0.738 | 0.353 | |
Significant difference between right and left sides.
The reference bone areas in the maxilla showed a significant difference (p=.010) only between the 4.5 mm right and left areas in the 6 mm section of the untreated group. For all the other comparisons, between right and left sides and treated and untreated groups, there was no statistically significant difference.
Table 2 shows the mean values of BMD and RMD of treated and untreated individuals, and the comparison between groups.
Table 2.
Mean values and comparison between right and left sides and treated and untreated groups.
| Untreated (N=30) | Treated (N=15) | P (t-test) | |||||||
|---|---|---|---|---|---|---|---|---|---|
| Right incisor | Left incisor | P (t-test) | Mean of sides | Right incisor | Left incisor | P (t-test) | Mean of sides | ||
| BMD | 673.05 (122.18) | 676.63 (111.27) | .805 | 674.84 (109.99) | 635.27 (111.95) | 625.28 (134.34) | .751 | 630.28 (108.26) | .205 |
| RMD | 1280.28 (92.61) | 1284.25 (85.5) | .660 | 1282.26 (85.72) | 1369.06 (58.82) | 1371.5 (58.71) | .788 | 1370.29 (56.17) | .001* |
Significant difference between groups.
The mean values for BMD and RMD were 674.84 and 1282.26 for the untreated group and 630.28 and 1370.29 for the treated group, respectively. A significant difference was observed between the groups only for RMD values (p<.05).
Descriptive statistics suggested that BMD and RMD variances might differ between the groups, Levene’s test being necessary for homoscedasticity verification. The groups did not significantly differ in BMD variance (p=.754), whereas there was a significant difference in RMD variance (p=.037). When the Mann-Whitney non-parametric test was used to verify the between-group RMD difference, the result was similar to that obtained with the t test (p=0.002), thus indicating a significant difference between the groups.
Discussion
The forces resulting from the action of orthodontic appliances move irregular teeth to better positions and produce mechanical stimuli that trigger biological responses which, in turn, lead to bone modeling and remodeling. While modeling is the sculpting mechanism that uses the raw materials of bone growth to shape structures, remodeling is the mechanism involving lifelong skeletal turnover and maintenance [1]. Because such bone responses are difficult to observe [4], few experimental studies in animals [10,22–25] and clinical short-term studies [4,26] are available, pointing to the need for greater investigation of the effects of tooth movement on the alveolar bone.
Hsu et al. [4] and Chang et al. [26] found a 24% BMD reduction around the teeth of the anterior maxilla in 8 patients investigated 7 months after orthodontic treatment. The results of this study indicated that the BMD of the closely root-associated alveolar bone of the orthodontically-moved upper central incisors did not differ from the BMD of the untreated group. This difference may be related to the post-treatment assessment time (mean 6.52 years), because a long period is necessary for bone recovery and mineralization after tooth movement [27], which allows the BMD to return to baseline (before tooth movement) values. The fact that the groups did not have a significant difference in the BMD of the maxillary reference areas suggests that the influence of tooth movement on bone quality is limited to a certain period of time after treatment.
In contrast with the BMD, the patients who had undergone orthodontic treatment had significantly higher RMD values than untreated patients. Although orthodontics-related alterations in the dentin surface, with increased mineralization rate, have already been reported [7,10,11], effects on the dentin matrix have not.
Dentin matrix has a peculiar morphology, being composed of 1–2 μm diameter tubules surrounded by a hyper-mineralized layer called peritubular dentin, and of a softer intertubular matrix, where the organic material concentrates as collagen fibrils and noncollagenous proteins [28].
Two proteins, DMP1 and DSPP, are responsible for similar structural alterations in the dentin matrix and surface, being present in predentin, odontoblasts and dentinal tubules [8]. These proteins are thought to play key biological roles in the mineralization of dentin because they are prominent in this mineralized tissue and are secreted into the extracellular matrix of dentin during formation and mineralization [29,30]. DMP1 and DSPP expression and levels are increased by mechanical stress [8,9], which may account for not only the increased dentin mineralization rate [7,10,11], but also for the increased mineral density of the peritubular extracellular matrix during tooth movement, because of acceleration of dentin mineralization [6]. Such structural alteration enhances biomechanical function, allowing a tougher foundation that helps to prevent propagation of cracks from the brittle enamel [28,31].
DMP1 and DSPP are also expressed by osteocytes, being involved in the development and/or maintenance of bone tissue and responding to mechanical stress as occurs in dentin [6,8]. However, significant BMD increases were not observed, probably due to the complete bone renewal during tooth movement, with resorption alongside the movement direction and deposition in the opposite direction.
Mineral density determination is the best indicator for the quality of mineralized tissues [5], and CBCT has been proposed as a low-radiation-dose method for achieving such a purpose [4,32], because the density evaluated shows a linear relationship with the attenuation coefficients of the materials [33] and HU values obtained with medical CT [32,34] and DEXA [35].
However, the arbitrary gray levels and artifacts displayed in CBCT systems do not allow the assessment of bone quality, which can be performed with HU in medical CT [36]. Such instability of grey levels was associated with different imaging devices [20,33,37], image-acquisition settings [33], positioning of the object in the FOV [20,38], the mass presented outside the FOV (dubbed the exo-mass) [37–39], the mass in the slice (inside and outside the FOV) [38] and the size of FOV [39]. Controlling for these variables has thus become essential for measurements of mineral density in CBCT images.
All patients, treated and untreated, were scanned with the same large-volume CBCT scan, which may yield more consistent density values than limited-volume CBCT scans [39], and under the same exposure conditions, which eliminated equipment and image-acquisition setting-related variations. According to Araki et al. [40], in a CBCT system designed to scan a large FOV with large-sized detectors, the influence of artifacts might be small and the HU application is possible. In spite of the disagreement on the correlation between the CBCT and HU MD values, we used the HU values as a comparative rather than an absolute measurement.
In CBCT images, the CT number of the same material tends to increase (brighter in gray scale) as the ROI approximates the to exo-mass [38,39], and/or the exo-mass increase [39] and/or the mass in slice increase [38], resulting in varied readings of the mineral density of a given structure. In the assessment of adults, standardization of the head orientation and its position in the FOV and the use of a standardized FOV size allowed the control of variables related to the structure mass, as the mass in slice (estimated as 7 g for each 0.4 mm slice of the adult head [38]), localization of the exo-mass and positioning of the upper incisors in the FOV were similar across the patients, resulting in the same distortion of the gray levels in the areas of interest assessed in this study.
The object position inside the FOV modifies the relation between the ROI and the exo-mass and influences mineral density determination, as reported by Nackaerts et al. [20], who demonstrated a significant variation when the object was repositioned in FOV between acquisitions. These authors used a FOV with a volume 35 times greater than ours, which may have influenced the results. Nevertheless, no conclusive information on the influence of FOV size on MD determination has been reported to date.
Katsumata et al. [39] described the possible influence of FOV size on MD, reporting a 381 HU (266–647) BMD variation in a half-mandible, in 51, 102, 153 and 200 mm diameter FOVs. Yet, these authors did not eliminate the exo-mass (present in the 51 mm FOV) and ROI positioning inside the FOV, adding the influence of other variables to their results, and leaving the issue of the influence of FOV size on MD determination in large-volume CBCT images unresolved.
In spite of the number of possibly influential variables of MD values in CBCT images, we adopted exam standardization for variable control. This may be verified by analysis of the maxillary reference areas, where no significant differences between treated and untreated individuals were observed. A significant difference was only verified between the right and left sides in the 4.5 mm lateral area in the 6 mm section of the untreated group, with 3 patients presenting discrepantly reduced BMD values on the right, with no apparent reason.
Conclusions
Individuals who had finished an orthodontic treatment at least 1 year previously had higher root mineral density means, compared with untreated individuals. On the other hand, the BMD did not show a significant difference between the groups.
Acknowledgment
The authors thank FAPEMIG and CNPq for supporting this study.
Footnotes
Source of support: FAPEMIG and CNPq
References
- 1.Roberts WE, Roberts JA, Epker BN, et al. Remodeling of mineralized tissues, part I: The Frost Legacy. Semin Orthod. 2006;12:216–37. [Google Scholar]
- 2.Simmons DJ, Chang SL, Russell JE, et al. The effect of protracted tetracycline treatment on bone growth and maturation. Clin Orthop Relat Res. 1983;180:253–59. [PubMed] [Google Scholar]
- 3.Russell JE, Grazman B, Simmons DJ. Mineralization in rat metaphyseal bone exhibits a circadian stage dependency. Proc Soc Exp Biol Med. 1984;176:342–45. doi: 10.3181/00379727-176-41880. [DOI] [PubMed] [Google Scholar]
- 4.Hsu JT, Chang HW, Huang HL, et al. Bone density changes around teeth during orthodontic treatment. Clin Oral Investig. 2010;15:511–19. doi: 10.1007/s00784-010-0410-1. [DOI] [PubMed] [Google Scholar]
- 5.Frost HM. The biology of fracture healing. An overview for clinicians. Part I. Clin Orthop Relat Res. 1989;248:283–93. [PubMed] [Google Scholar]
- 6.Kong X, Cao M, Ye R, Ding Y. Orthodontic force accelerates dentine mineralization during tooth development in juvenile rats. Tohoku J Exp Med. 2010;221:265–70. doi: 10.1620/tjem.221.265. [DOI] [PubMed] [Google Scholar]
- 7.Giunta D, Keller J, Nielsen FF, Melsen B. Dentin formation in miniature pigs with special reference to indomethacin and orthodontic treatment. Scand J Dent Res. 1993;101:261–64. doi: 10.1111/j.1600-0722.1993.tb01116.x. [DOI] [PubMed] [Google Scholar]
- 8.Baba O, Qin C, Brunn JC, et al. Colocalization of dentin matrix protein 1 and dentin sialoprotein at late stages of rat molar development. Matrix Biol. 2004;23:371–79. doi: 10.1016/j.matbio.2004.07.008. [DOI] [PubMed] [Google Scholar]
- 9.Gluhak-Heinrich J, Ye L, Bonewald LF, et al. Mechanical loading stimulates dentin matrix protein 1 (DMP1) expression in osteocytes in vivo. J Bone Miner Res. 2003;18:807–17. doi: 10.1359/jbmr.2003.18.5.807. [DOI] [PubMed] [Google Scholar]
- 10.Melsen B. Biological reaction of alveolar bone to orthodontic tooth movement. Angle Orthod. 1999;69:151–58. doi: 10.1043/0003-3219(1999)069<0151:BROABT>2.3.CO;2. [DOI] [PubMed] [Google Scholar]
- 11.Melsen B, Melsen F, Rolling I. Dentine formation rate in human teeth. Calcif Tissue Res. 1977;23:R16. [Google Scholar]
- 12.Brezniak N, Wasserstein A. Root resorption after orthodontic treatment: Part 1. Literature review. Am J Orthod Dentofacial Orthop. 1993;103:62–66. doi: 10.1016/0889-5406(93)70106-X. [DOI] [PubMed] [Google Scholar]
- 13.Brezniak N, Wasserstein A. Root resorption after orthodontic treatment: Part 2. Literature review. Am J Orthod Dentofacial Orthop. 1993;103:138–46. doi: 10.1016/S0889-5406(05)81763-9. [DOI] [PubMed] [Google Scholar]
- 14.Wierzbicki T, El-Bialy T, Aldaghreer S, Li G, Doschak M. Analysis of orthodontically induced root resorption using micro-computed tomography (Micro-TC) Angle Orthod. 2009;79:91–96. doi: 10.2319/112107-546.1. [DOI] [PubMed] [Google Scholar]
- 15.Lindh C, Obrant K, Petersson A. Maxillary bone mineral density and its relationship to the bone mineral density of the lumbar spine and hip. Oral Surg Oral Med Oral Pathol Oral Radiol Endod. 2004;98:102–9. doi: 10.1016/s1079-2104(03)00460-8. [DOI] [PubMed] [Google Scholar]
- 16.Turkyilmaz I, Tozum TF, Tumer C. Bone density assessments of oral implant sites using computerized tomography. J Oral Rehab. 2007;34:267–72. doi: 10.1111/j.1365-2842.2006.01689.x. [DOI] [PubMed] [Google Scholar]
- 17.De Oliveira RCG, Leles CR, Normanha LM, et al. Assessments of trabecular bone density at implant sites on CT images. Oral Surg Oral Med Oral Pathol Oral Radiol Endod. 2008;105:231–38. doi: 10.1016/j.tripleo.2007.08.007. [DOI] [PubMed] [Google Scholar]
- 18.Park HS, Lee YJ, Jeong SH, Kwon TG. Density of the alveolar and basal bones of the maxilla and the mandible. Am J Orthod Dentofacial Orthop. 2008;133:30–37. doi: 10.1016/j.ajodo.2006.01.044. [DOI] [PubMed] [Google Scholar]
- 19.Choi JH, Park CH, Yi SW, et al. Bone density measurement in interdental areas with simulated placement of orthodontic miniscrew implants. Am J Orthod Dentofacial Orthop. 2009;136:766.e1–12. doi: 10.1016/j.ajodo.2009.04.019. [DOI] [PubMed] [Google Scholar]
- 20.Nackaerts O, Maes F, Yan H, et al. Analysis of intensity variability in multislice and cone beam computed tomography. Clin Oral Implants Res. 2011;22:873–79. doi: 10.1111/j.1600-0501.2010.02076.x. [DOI] [PubMed] [Google Scholar]
- 21.Conover WJ. Practice nonparametric statistics. New York: Wiley; 1999. [Google Scholar]
- 22.Bridges T, King G, Mohammed A. The effect of age on tooth movement and mineral density in the alveolar tissues of the rat. Am J Orthod Dentofacial Orthop. 1988;93:245–50. doi: 10.1016/s0889-5406(88)80010-6. [DOI] [PubMed] [Google Scholar]
- 23.Melsen B. Tissue reaction to orthodontic tooth movement – a new paradigm. Eur J Orthod. 2001;23:671–81. doi: 10.1093/ejo/23.6.671. [DOI] [PubMed] [Google Scholar]
- 24.Verna C, Dalstra M, Melsen B. The rate and the type of orthodontic tooth movement is influenced by bone turnover in a rat model. Eur J Orthod. 2000;22:343–52. doi: 10.1093/ejo/22.4.343. [DOI] [PubMed] [Google Scholar]
- 25.Verna C, Melsen B. Tissue reaction to orthodontic tooth movement in different bone turnover conditions. Orthod Craniofac Res. 2003;6:155–63. doi: 10.1034/j.1600-0544.2003.03262.x. [DOI] [PubMed] [Google Scholar]
- 26.Chang HW, Huang HL, Yu JH, et al. Effects of orthodontic tooth movement on alveolar bone density. Clin Oral Invest. 2012;16:679–88. doi: 10.1007/s00784-011-0552-9. [DOI] [PubMed] [Google Scholar]
- 27.Junqueira LC, Carneiro J. Basic Histology. 11nd ed. New York: McGraw-Hill; 2005. [Google Scholar]
- 28.Bertassoni LE, Stankoska K, Swain MV. Insights into the structure and composition of the peritubular dentin organic matrix and the laminalimitans. Micron. 2012;43:229–36. doi: 10.1016/j.micron.2011.08.003. [DOI] [PubMed] [Google Scholar]
- 29.Butler WT. Dentin matrix proteins. Eur J Oral Sci. 1998;106:204–10. doi: 10.1111/j.1600-0722.1998.tb02177.x. [DOI] [PubMed] [Google Scholar]
- 30.Jain A, Karadag A, Fohr B, et al. Three SIBLINGs (small integrin-binding ligand, N-linked glycoproteins) enhance factor H’s cofactor activity enabling MCP-like cellular evasion of complement-mediated attack. J Biol Chem. 2002;277:13700–8. doi: 10.1074/jbc.M110757200. [DOI] [PubMed] [Google Scholar]
- 31.Imbeni V, Kruzic JJ, Marshall GW, et al. The dentin-enamel junction and the fracture of human teeth. Nat Mater. 2005;4:229–32. doi: 10.1038/nmat1323. [DOI] [PubMed] [Google Scholar]
- 32.Aranyarachkul P, Caruso J, Gantes B, et al. Bone density assessments of dental implant sites: 2. Quantitative cone-beam computerized tomography. Int J Oral Maxillofac Implants. 2005;20:416–24. [PubMed] [Google Scholar]
- 33.Mah P, Reeves TE, McDavid WD. Deriving Hounsfield units using grey levels in cone beam computed tomography. Dentomaxillofac Radiol. 2010;39:323–35. doi: 10.1259/dmfr/19603304. [DOI] [PMC free article] [PubMed] [Google Scholar]
- 34.Lagraves MO, Carey J, Ben-Zvi M, et al. Effect of object location on the density measurement and Hounsfield conversion in a NewTom 3G cone beam computed tomography unit. Dentomaxillofacial Radiol. 2008;37:305–8. doi: 10.1259/dmfr/65993482. [DOI] [PubMed] [Google Scholar]
- 35.Marquezan M, Lau TC, Mattos CT, et al. Bone mineral density. Angle Orthod. 2012;82:62–66. doi: 10.2319/031811-192.1. [DOI] [PMC free article] [PubMed] [Google Scholar]
- 36.Norton MR, Gamble C. Bone classification: an objective scale of bone density using the computerized tomography scan. Clin Oral Impl Res. 2001;12:79–84. doi: 10.1034/j.1600-0501.2001.012001079.x. [DOI] [PubMed] [Google Scholar]
- 37.Katsumata A, Hirukawa A, Okumura S, et al. Effects of image artifacts on gray-value density in limited-volume cone-beam computerized tomography. Oral Surg Oral Med Oral Pathol Oral Radiol Endod. 2007;104:829–36. doi: 10.1016/j.tripleo.2006.12.005. [DOI] [PubMed] [Google Scholar]
- 38.Bryant JA, Drage NA, Richmond S. Study of the scan uniformity from an i-CAT cone beam computed tomography dental imaging system. Dentomaxillofac Radiol. 2008;37:365–74. doi: 10.1259/dmfr/13227258. [DOI] [PubMed] [Google Scholar]
- 39.Katsumata A, Hirukawa A, Okumura S, et al. Relationship between density variability and imaging volume size in cone-beam computerized tomographic scanning of the maxillofacial region: an in vitro study. Oral Surg Oral Med Oral Pathol Oral Radiol Endod. 2009;107:420–25. doi: 10.1016/j.tripleo.2008.05.049. [DOI] [PubMed] [Google Scholar]
- 40.Araki K, Maki K, Seki K, et al. Characteristics of a newly developed dentomaxillofacial X-ray cone bean CT scanner (CB MercuRay): system configuration and physical properties. Dentomaxillofac Radiol. 2004;33:51–59. doi: 10.1259/dmfr/54013049. [DOI] [PubMed] [Google Scholar]


