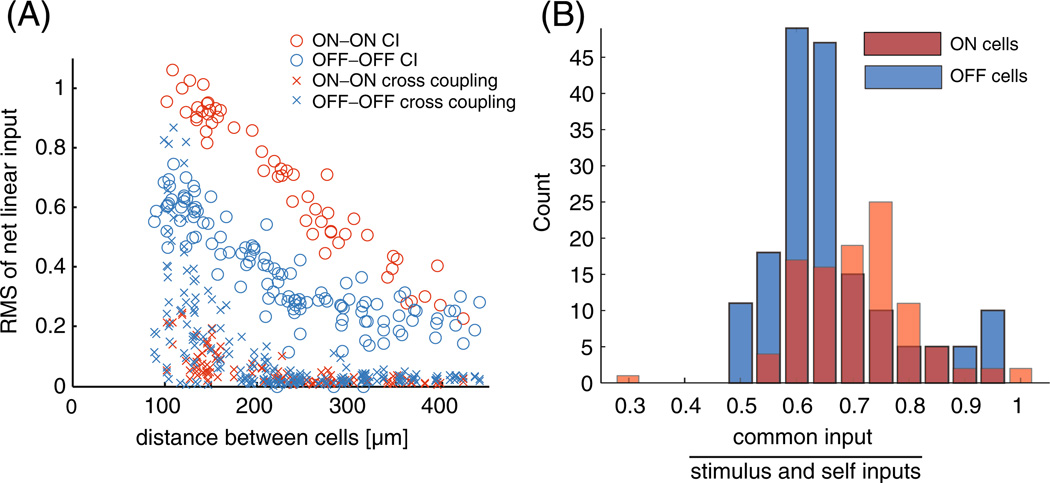
Fig. 3.
Population summary of the inferred strength of the inputs to the model. (A) Summary plot of the relative contribution of the common noise (circles) and cross-coupling inputs (crosses) to the cells as a function of the cells’ distance from each other in the pairwise model for the complete network of 27 cells. Note that the common noise is stronger then the cross-coupling input in the large majority of the cell pairs. Since the OFF cells have a higher spike rate on average, the OFF–OFF cross-coupling inputs have a larger contribution on average than the ON–ON cross-coupling inputs. However, the filter magnitudes agree with the results of Trong and Rieke (2008); the cross-coupling filters between ON cells are stronger, on average, than the cross-coupling filters between OFF cells (not shown). The gap under 100 µm is due to the fact that RGCs of the same type have minimal overlap (Gauthier et al. 2009). (B) Histograms showing the relative magnitude of the common noise and stimulus plus post-spike filter induced inputs to each cell under the common-noise model. The X-axis is the ratio of the RMS of each of these inputs . Common inputs tend to be a bit more than half as strong as the stimulus and post-spike inputs combined

