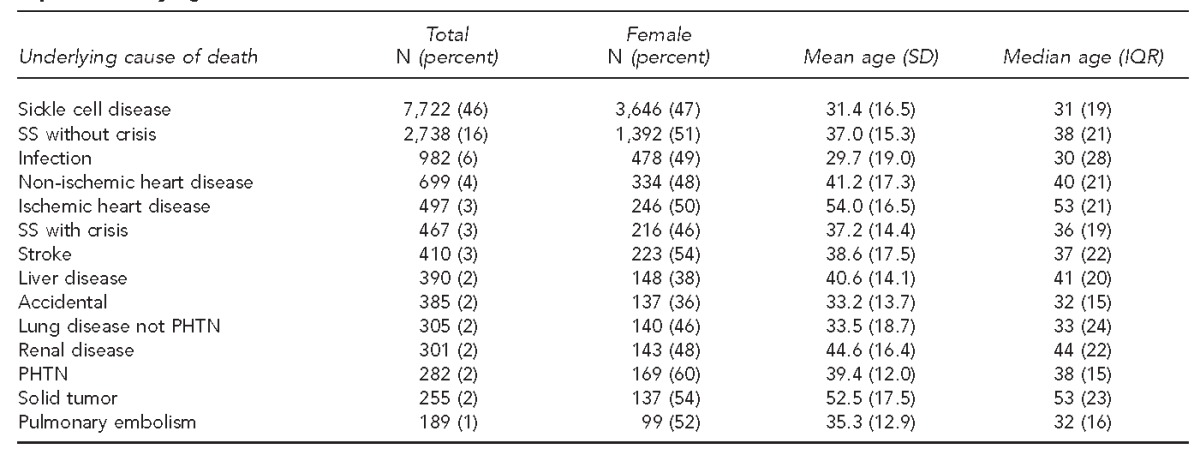
Table 1.
Demographic characteristics of people with sickle cell disease who died from the top 14 underlying causes of death: U.S., 1979–2005a

aThe table represents 93.8% of all deaths during this time period. All other diagnoses were present in <1% of deaths.
SD = standard deviation
IQR = interquartile range
SS = homozygous S
PHTN = pulmonary hypertension
