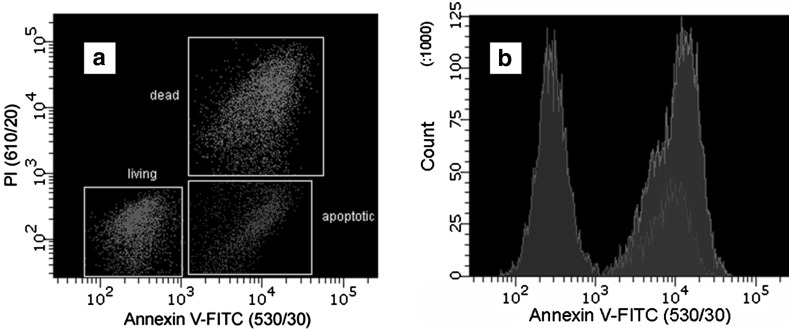
Fig. 4.
Flow cytometry of T lymphoblastoid cells treated by actinomycin D and stained by annexin V-FITC and PI. FITC and PI were selectively excited at 488 nm and their fluorescence at 530 and 610 nm, respectively, was collected simultaneously. a Cells are sorted into living (dark green), dead (purple), and apoptotic (blue) cell populations by the absolute intensities of the two probes. Note that on both coordinates the scale is logarithmic. b Histograms plotted on the basis of intensity response of bound annexin V-FITC (Shynkar et al. 2007). (Color figure online)

