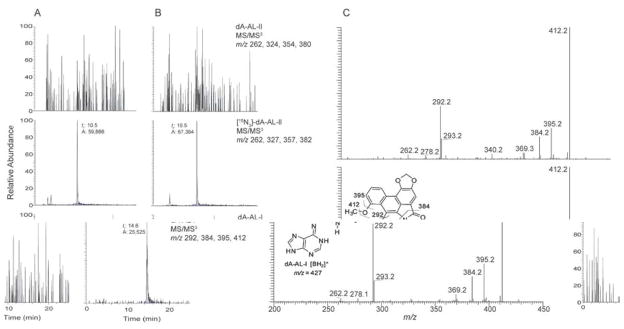
Figure 2.

Mass spectroscopic characterization of DNA-aristolactam (AL) adducts in the renal cortex. (A) Reconstructed ion chromatogram of the liquid chromatography electrospray ionization/multistage mass spectrometry (LC-ESI/MS/MS3) analysis of dA-AL adducts. (A) Calf thymus DNA served as the negative control and was spiked with the internal standard [15N3]-dA-AL-II at a level of 5 adducts per 108 DNA bases and (B) DNA sample from a UUC subject from Croatia, the level of the [15N3]-dA-AL-II internal standard was 4.2 adducts per 108 DNA bases. The chromatograms for dA-AL-I, dA-AL- II and [15N3]-dA-AL-II were reconstructed with the four principal fragment ions observed in the spectra of the MS3 stage scan mode. The level of dA-AL-I was estimated at 1.5 adducts/108 bases (based on total ion counts of dA-AL-I to [15N3]-dA-AL-II total ion counts). (C) The product ion spectra of the protonated base adduct [BH2]+ for synthetic dA-AL-I (lower panel) and the DNA adduct found in the human renal cortex (upper panel).
