
Figure 3.
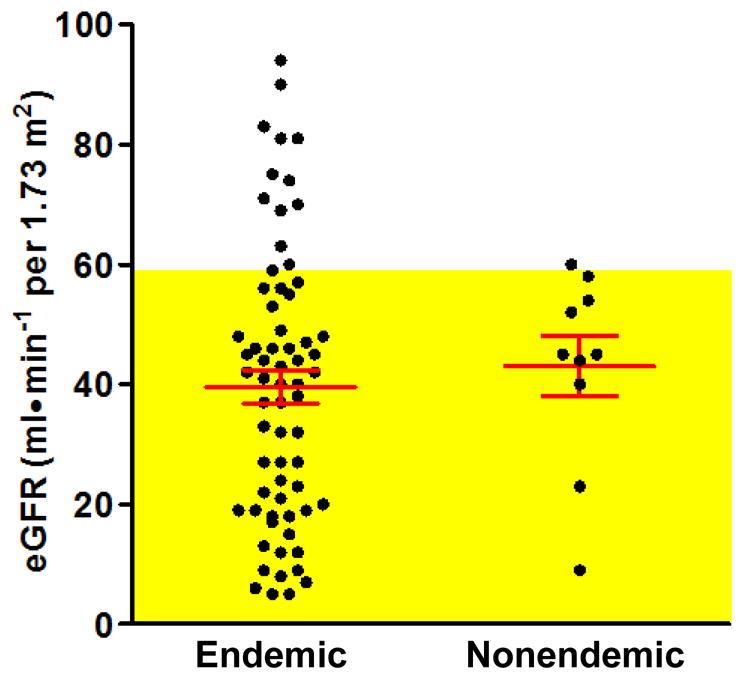
Distribution of estimated glomerular filtration rate (eGFR) values, calculated with the MDRD formula, among UUC cases from endemic and nonendemic villages. Values corresponding to CKD stage 3 or higher are shaded in yellow. Red lines indicate the mean ± SEM of each cohort.