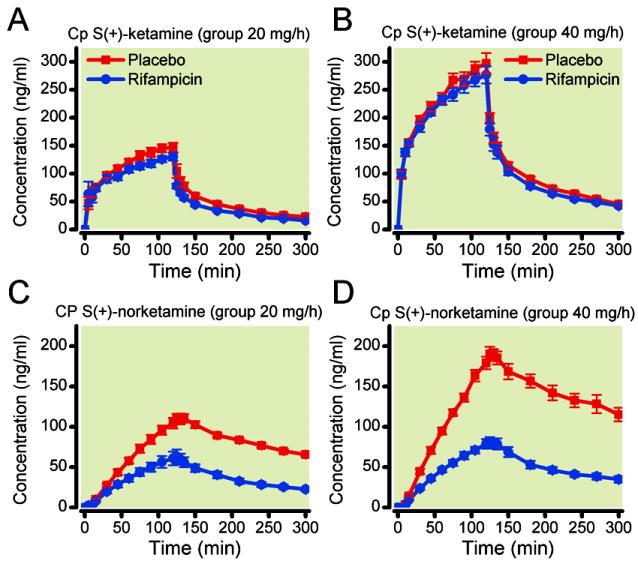
Figure 3.

Effect of rifampicin treatment on plasma concentrations of S-ketamine (A and B) and S-norketamine (C and D) during and 3-h following a 2-h S(+)-ketamine infusion of 20 mg/h (A and C) and 40 mg/h (B and D). Values are mean ± SEM. The grey bars depict the 2-h infusion period.
