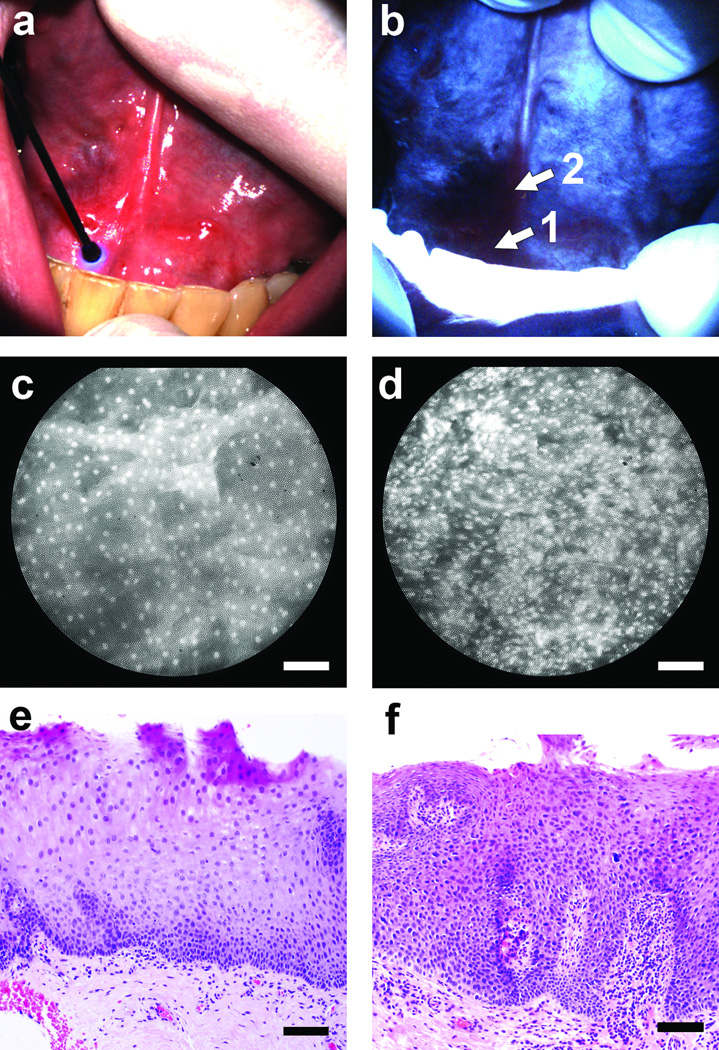
Figure 2.
Multi-modal optical imaging at the floor-of-mouth. (a) The entire area appeared normal on clinical examination. (b) Autofluorescence imaging revealed a region with distinct loss of fluorescence intensity at the patient’s right side. (c,d) High-resolution microendoscope images with the probe placed at sites “1” and “2” in panel (b), respectively. (e,f) Histopathology sections from sites “1” and “2” in panel (b). Scale bars represent 100 µm.

