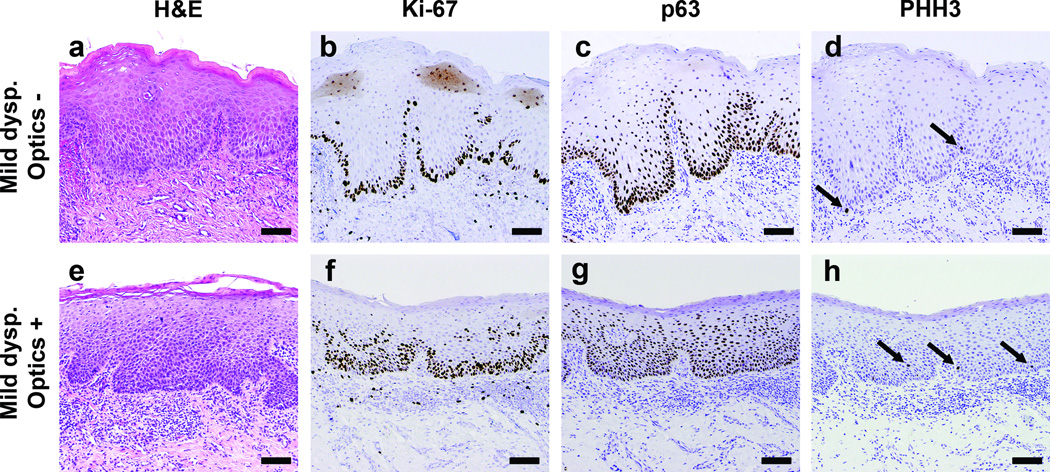
Figure 4.
Histopathology sections of tissue from two sites with a diagnosis of mild dysplasia. (a-d) Sections from a site which was classified as “normal” by optical measurement. (e-h) Sections from a site classified as “abnormal” by optical measurement. (a,e) H&E stained sections used by the study pathologist to classify each site as mild dysplasia. Immunostained sections from the same sites with (b) Ki-67, graded low, (c) p63, low (d) PHH3, low, (f) Ki-67, moderate, (g) p63, high, (h) PHH3, high. Scale bars represent 100 µm.

