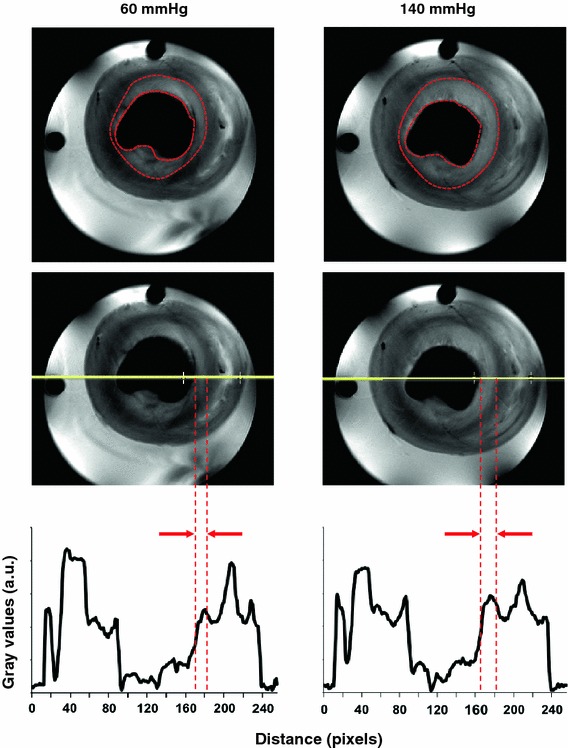
Fig. 7.

Representative CE-MR images for the same mid-axial slice of an isolated rat heart perfused a at 60 mmHg and b at 140 mmHg. c The signal profiles corresponding to the red lines across the images. The enhanced subendocardial area (marked with red dashed line) at 140 mmHg was larger than at 60 mmHg (p = 0.01), which can also be appreciated from the signal profile (c). The signal intensity of the subendocardial area was higher than the epicardial area both at 60 and 140 mmHg (p < 0.03)
