Figure 1.
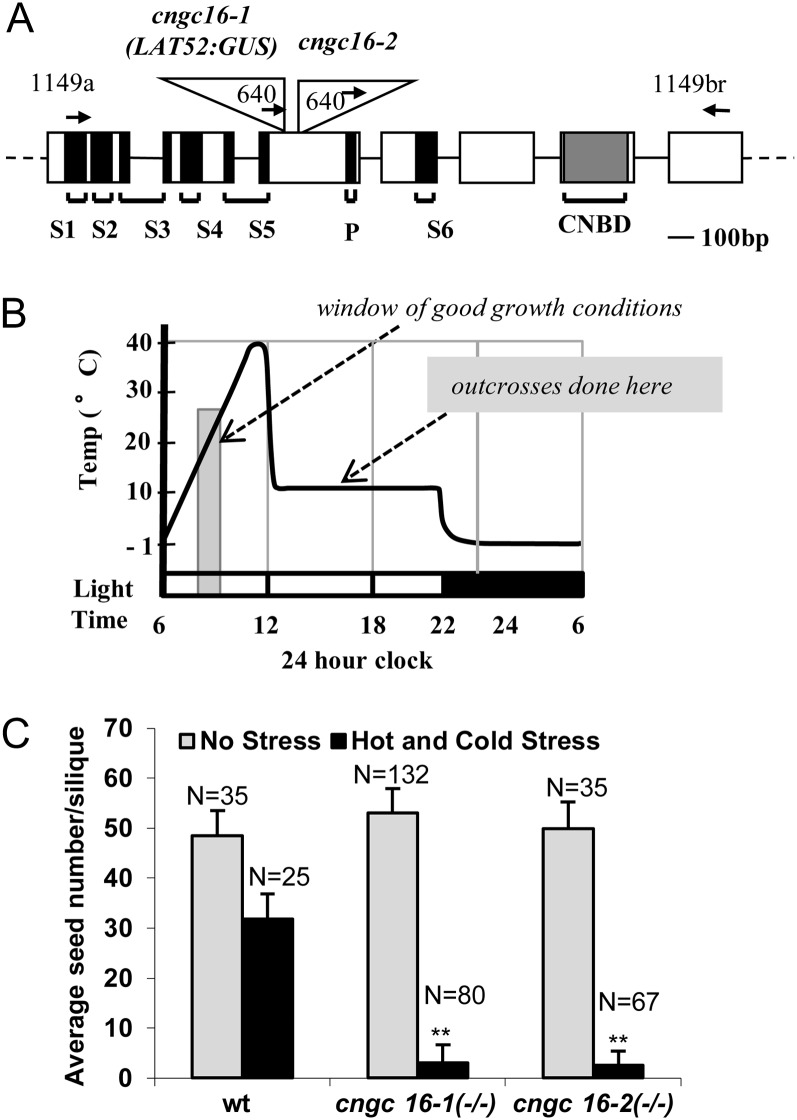
Knockout mutations for cngc16 and corresponding stress-dependent seed set phenotype. A, Schematic diagram of CNGC16 gene model (AT3G48010) and T-DNA insertion sites in cngc16-1 and cngc16-2. Positions are shown for T-DNA insertions (triangles), exons (rectangles), introns (lines), and primers (arrows). Black regions represent transmembranes (S1–S6) and pore (P) domains in the corresponding protein. Gray shading represents the cyclic nucleotide binding domain (CNBD). B, Schematic diagram of the hot day and cold night stress cycling from −1°C to 40°C and forcing the period of pollen tube growth and fertilization to overlap with suboptimal temperatures. C, Seed set analysis of cngc16 shows a near-sterile phenotype under the hot/cold stress conditions diagrammed in B. n, Number of siliques counted. Student’s t test was performed to detect significant differences between cngc16 mutants and the wild type (wt) under hot and cold stress. **Student’s t test significant at P < 0.01.

