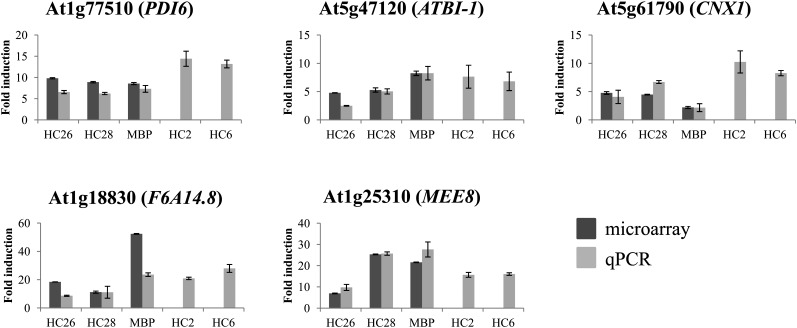
Figure 4.
The degree of gene induction is independent of the recombinant antibody accumulation level, except for MEE8. Fold induction relative to Col-0 of five differentially expressed genes is shown in five lines with different levels of recombinant antibody accumulation: 5% of the TSP in HC26, 10% in HC28 and MBP39, 1% to 2% in HC2, and 5% in HC26. The qPCR data (light gray) are plotted in comparison with the microarray data (dark gray). Two transgenic lines (HC2 and HC6) were analyzed only by qPCR. Error bars indicate sd of two or three biological repeats.

