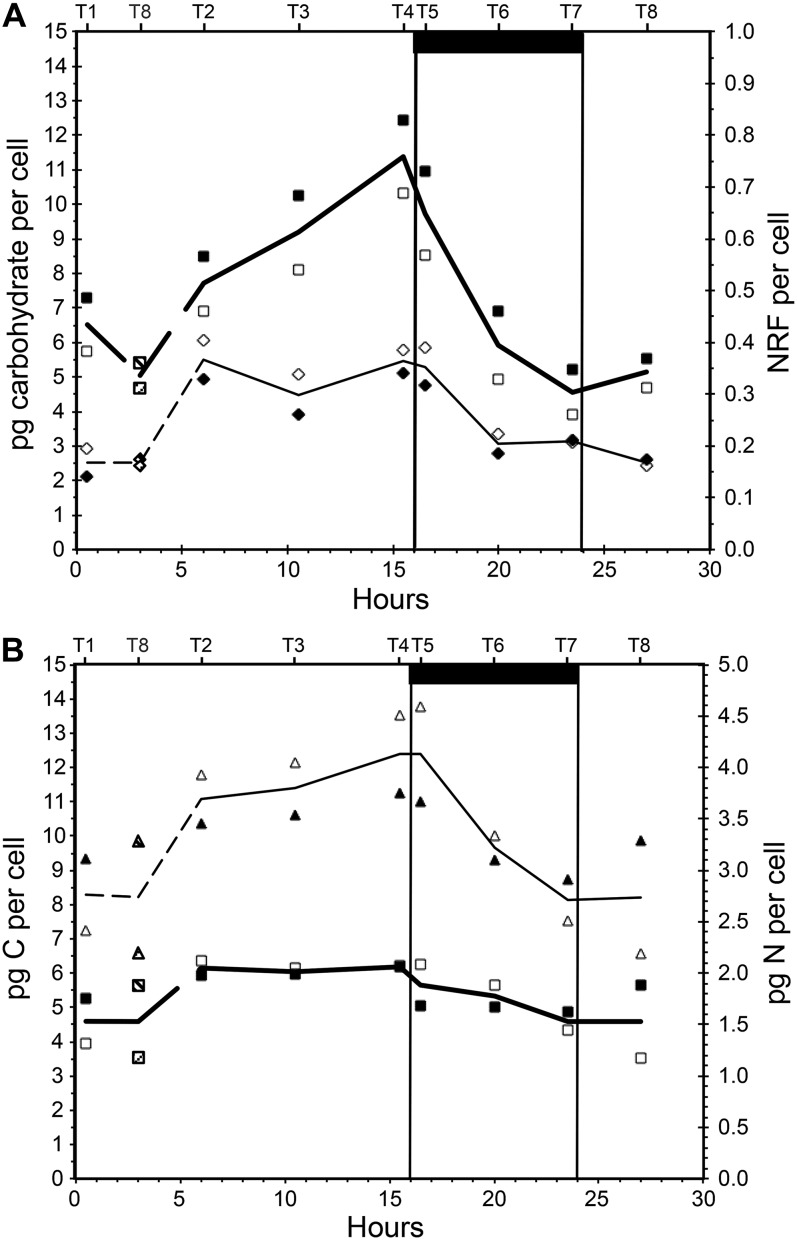
Figure 1.
Variation in cell chemistry over a 16/8-h light/dark cycle in P. tricornutum. A, Water-soluble carbohydrates (pg cell−1; squares) and cell specific NRF (diamonds, right axis). B, Cellular content of carbon (pg cell−1; triangles) and nitrogen (pg cell−1; squares, right axis). White and black symbols represent replicate cultures, and lines show averages of the two replicate data series. The bottom x axis shows hours from light on in the morning, and the top x axis shows sampling times labeled T1 to T8. The last sampling point in the series (T8, sampled at 27 h after start) corresponds to a point between T1 and T2 (0.5 and 6 h after start) and has been indicated in the graphs (dashed lines and shaded symbols). The dark bar at top and vertical lines indicate the period when the light was off.

