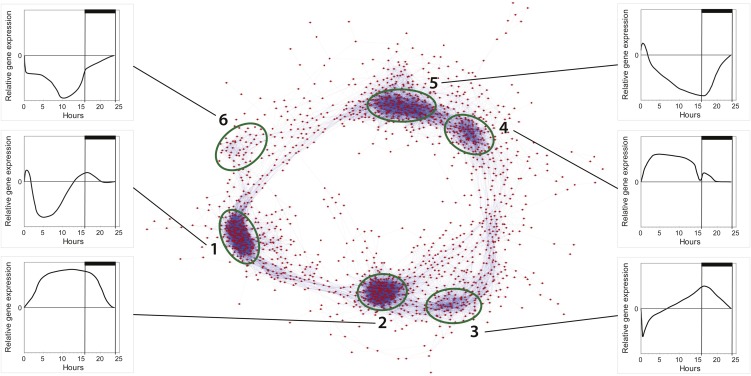
Figure 2.
Coexpression network of diel cycling genes in P. tricornutum. A network representation of the 1,936 most responsive genes in the experiment was made using Cytoscape and Pearson correlation values (r > 0.95) for each gene pair. In total, 44,003 gene pairs are included. Six clusters of tightly coregulated genes are distinguished, and graphs showing the general expression pattern of a given cluster (normalized to time point T7, 23.5 h) are presented for each cluster (labeled 1–6). [See online article for color version of this figure.]

