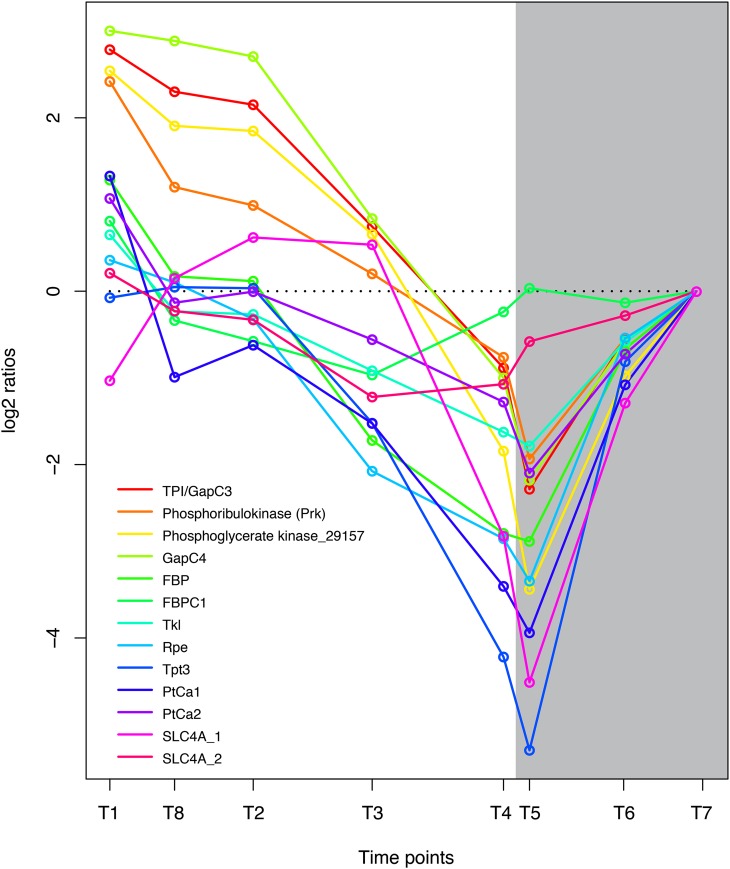
Figure 3.
Coordinated regulation of genes coupled to carbon fixation in P. tricornutum. Expression levels at sampling points (hours after light on) T1 = 0.5, T8 = 27 (day 2), T2 = 6, T3 = 10.5, T4 = 15.5, T5 = 16.5 (darkness), T6 = 20 (darkness), and T7 = 23.5 (darkness) are normalized to time point T7. GenBank accession numbers are as follows: TPI/GapC3, EEC50801.1; Prk, ACI65926.1; Phatr2_29157, EEC46310; GapC4, EEC50484.1; FBP, EEC44418.1; FBPC1, EEC51753.1; Tkl, EEC50321.1; Rpe, EEC51500.1; Tpt3, EEC51811.1; PtCa1, EEC51057.1; PtCa2, EEC48791.1; SLC4A_1, EEC48911.1; SLC4A_2, EEC51950.1. [See online article for color version of this figure.]

