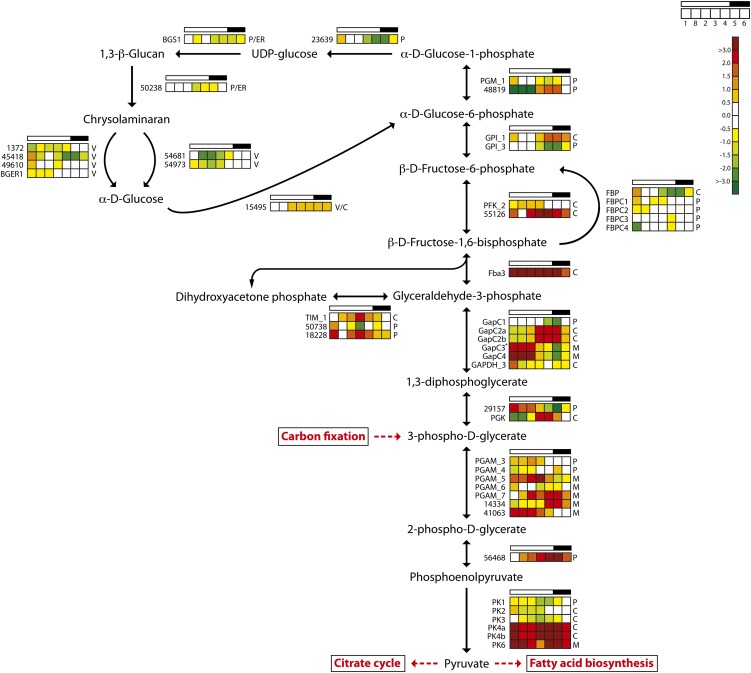
Figure 4.
Light/dark cycle regulation of genes encoding glycolytic and glucan biosynthesis enzymes in P. tricornutum. Colored squares indicate expression levels at time points (hours after light on) T1 = 0.5, T8 = 27 (day 2), T2 = 6, T3 = 10.5, T4 = 15.5, T5 = 16.5 (darkness), and T6 = 20 (darkness), and the data are normalized to time point T7 = 23.5 (darkness). Light and dark periods are indicated in the bar above the squares. The color scale indicates log2-transformed gene expression ratios. +GAPC3 is a protein fusion with TPI. BGER, β-Glucan elicitor receptor; BGS, 1,3-β-glucan synthase; C, cytosolic localization; M, mitochondrial localization; P, plastid localization; PFK, phosphofructokinase; PGAM, phosphoglycerate mutase; PGK, phosphoglycerate kinase; PK, pyruvate kinase; TIM, triosephosphate isomerase; V, vacuolar localization. [See online article for color version of this figure.]

