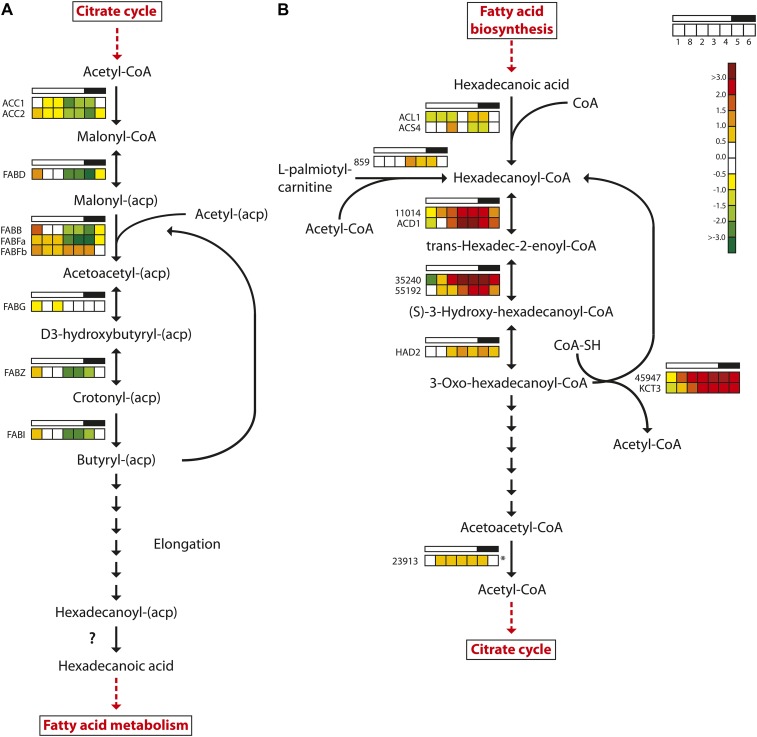
Figure 6.
Light/dark cycle regulation of genes encoding fatty acid metabolism enzymes in P. tricornutum. A, Fatty acid biosynthesis. B, Fatty acid β-oxidation. Colored squares indicate expression levels at time points (hours after light on) T1 = 0.5, T8 = 27 (day 2), T2 = 6, T3 = 10.5, T4 = 15.5, T5 = 16.5 (darkness), and T6 = 20 (darkness), and the data are normalized to time point T7 = 23.5 (darkness). Light and dark periods are indicated in the bar above the squares. The color scale indicates log2-transformed gene expression ratios. The question mark indicates that no candidate gene for the enzyme activity has been identified. The asterisk indicates that the gene did not show significantly differential expression (P < 0.05) at any time point. ACC, Acetyl-CoA carboxylase; FABB/FABF, 3-oxoacyl-[acyl carrier protein] synthase; FABD, malonyl-CoA transacylase; FABG, 3-oxoacyl-(acyl carrier protein) reductase; FABI, enoyl-ACP reductase; FABZ, 3R-hydroxyacyl-[acyl carrier protein] dehydrase; HAD, 3-hydroxyacyl-CoA dehydrogenase; KCT, β-ketoacyl-CoA thiolase. [See online article for color version of this figure.]

