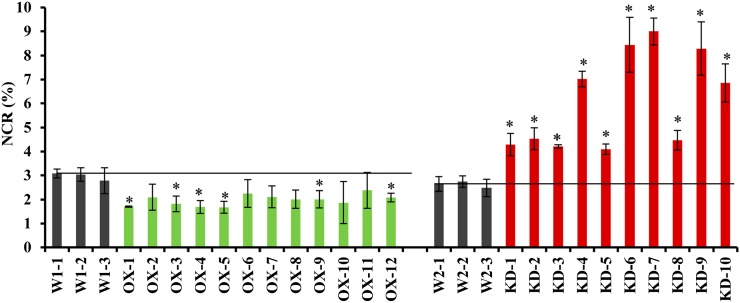
Figure 2.
NCRs in OX and KD lines. NCR (%) was calculated as nornicotine/(nicotine + nornicotine) × 100%. Control lines (shown in black) had average NCRs of 2.96% (OX experiment) and 2.62% (KD experiment), which were then used to draw baselines across the figure for comparison with OX (shown in green) and KD (shown in red) lines. Data represent averages of two independent measurements ± sd. Each independent measurement consisted of three replicates. Asterisks indicate significant differences (P < 0.05) of NCRs between an individual transgenic line and the average of three control lines. [See online article for color version of this figure.]

