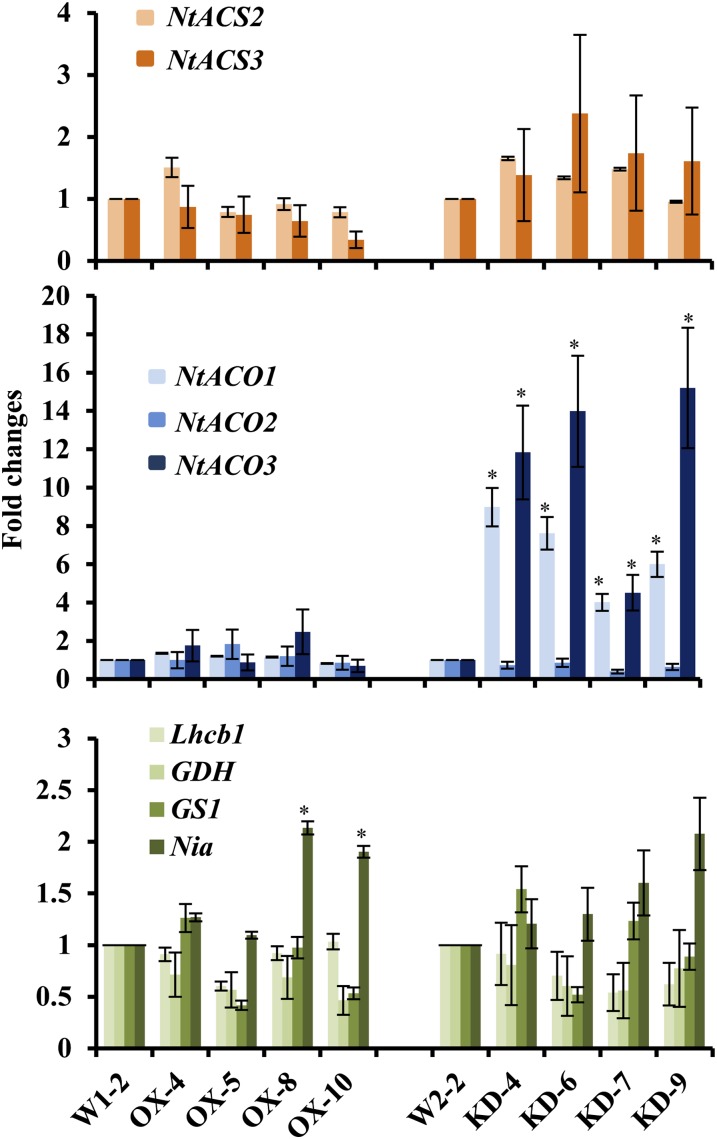
Figure 4.
Expression levels of ethylene biosynthesis genes ACS and ACO and five senescence-related genes, CP1, GS1, GDH, Lhcb1, and Nia, in selected OX and KD lines. The expression level of each gene was quantified by SYBR Green-based qRT-PCR. Data shown are fold changes calculated as transcript levels in OX and KD lines compared with control lines (W1-2 for OX lines and W2-2 for KD lines). The control line value is defined as 1. Data represent averages of three independent assays ± sd. Each assay was done in triplicate. *P < 0.05. [See online article for color version of this figure.]

