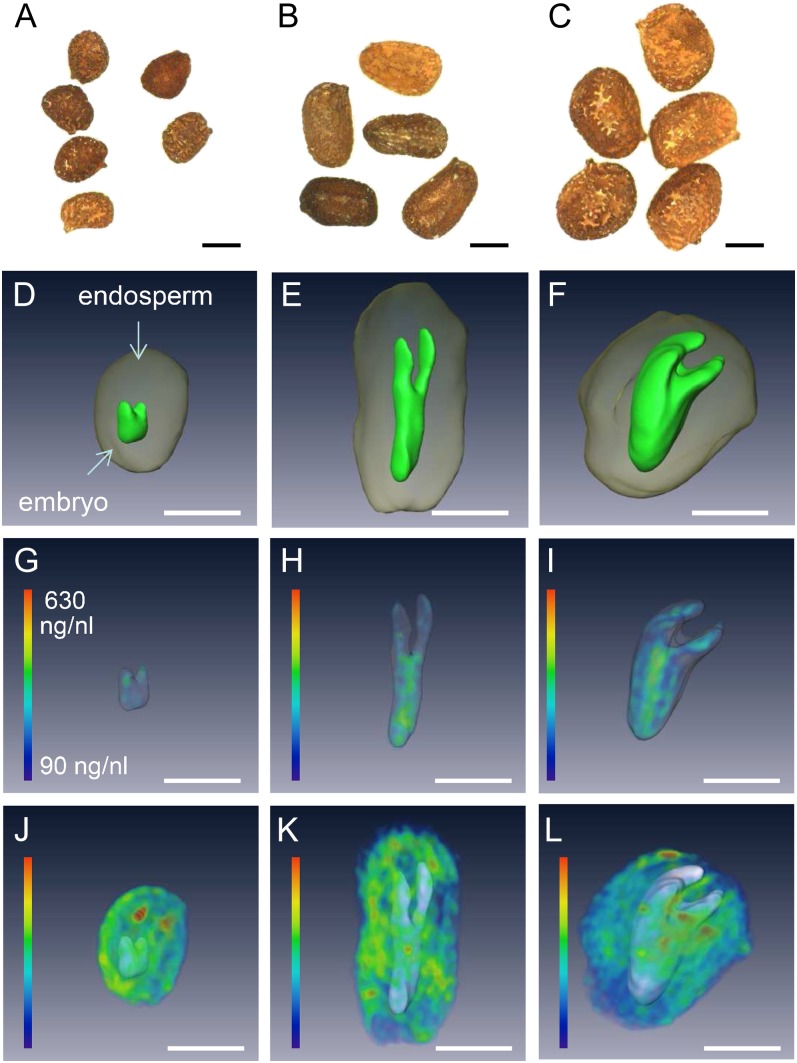
Figure 6.
MRI visualization of the distribution of lipids within an individual seed of N. tomentosiformis (A, D, G, and J), N. sylvestris (B, E, H, and K), and N. tabacum (C, F, I, and L). A to C, An intact seed as used for imaging. D to F, Three-dimensional model showing the embryo (green) surrounded by the endosperm (gray). G to I, Three-dimensional visualization of lipid distribution within the embryo. J to L, Three-dimensional visualization of lipid distribution within the endosperm. Lipid concentration (µL ng−1) indicated by color coding as shown in G. Bars = 200 µm.

