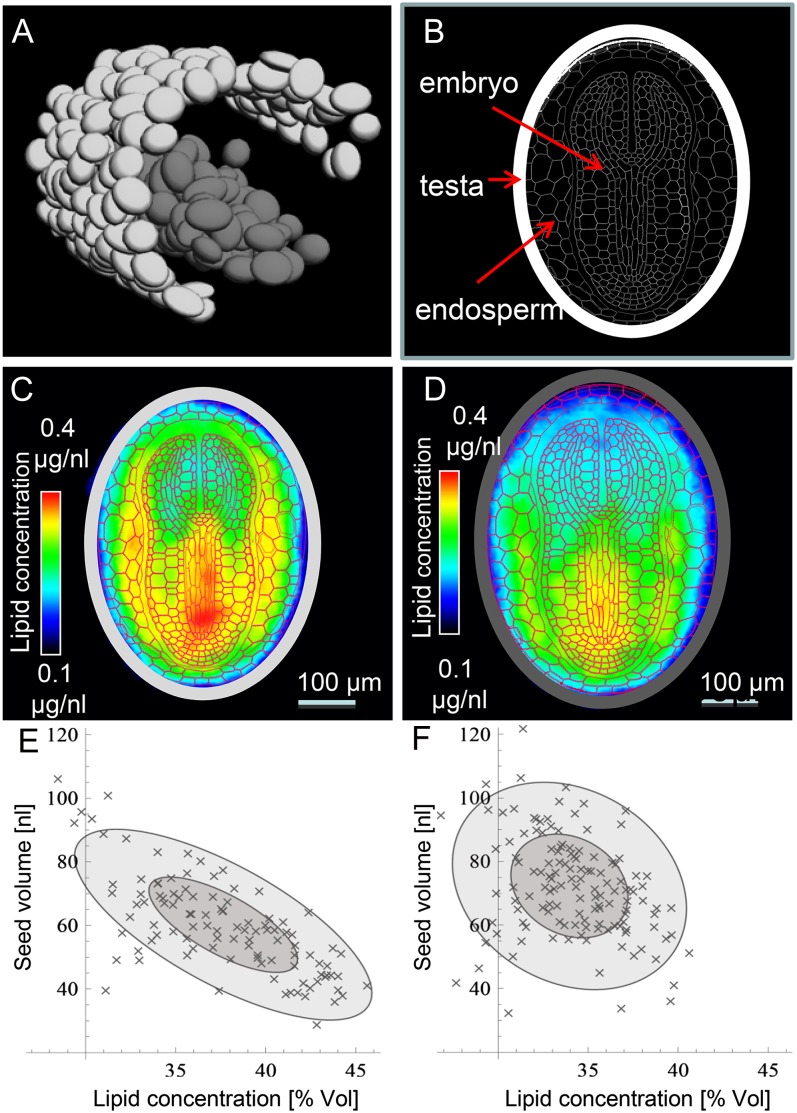
Figure 7.
High-throughput MRI visualization and quantification of lipid content in intact tobacco seeds. A, The wild type (dark gray) and transgenic (light gray) “virtual seed” inside the NMR tubes. B, Arrangement of tissues within the tobacco seed. C and D, A representative transgenic (C) and wild-type (D) virtual model seed. E and F, Relationship between seed size and lipid content (given in percentage of volume) along an individual transgenic (E) and wild-type (F) seed. The size of the ellipses is determined by sd of the principal components (dark gray 1 σ; light gray 2 σ), and the obliqueness of the ellipse indicates the correlation between the size and the lipid concentration of the seed specimen.

