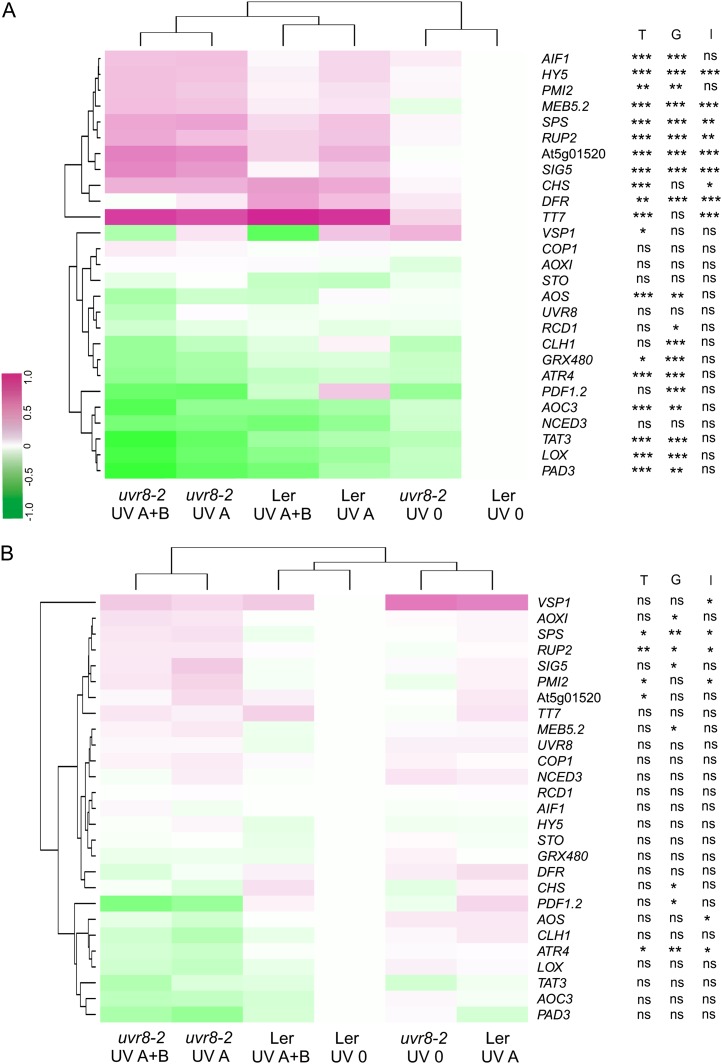
Figure 2.
Heat maps showing patterns of gene expression measured by qPCR in wild-type (Ler) and uvr8-2 plants after 12 h (A) and 36 h (B) outdoors. Means of log-transformed expression values relative to wild-type UV 0 are presented (n = 3). Main significant effects of the UV treatments (T), genotype (G), and the interaction UV treatment × genotype (I) on the expression of each gene are denoted with asterisks (*P ≤ 0.05, **P ≤ 0.01, and ***P ≤ 0.001), and ns indicates nonsignificant effects.

