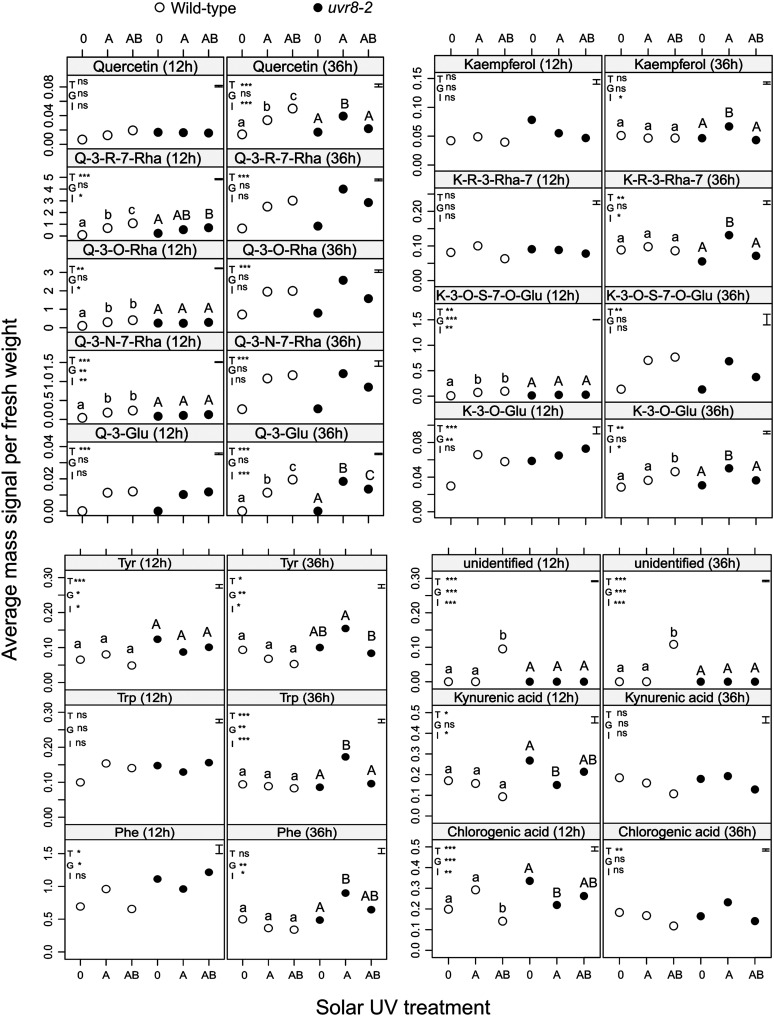
Figure 4.
Mass signals per mg of fresh weight of metabolites where ANOVA detected significant UV treatment × genotype interaction after 12 or 36 h outdoors. Main significant effects of the UV treatments (T), genotype (G), and the interaction UV treatment × genotype (I) on the accumulation of particular metabolites are denoted by asterisks (*P ≤ 0.05, **P ≤ 0.01, and ***P ≤ 0.001), and ns stands for nonsignificant effects. Average mass signals for each metabolite are presented (n = 5). The se estimated for each model is also plotted at the left top corner of every panel. Significant differences among treatments (P ≤ 0.05) are represented with different lowercase letters for the wild type and uppercase letters for uvr8-2.

