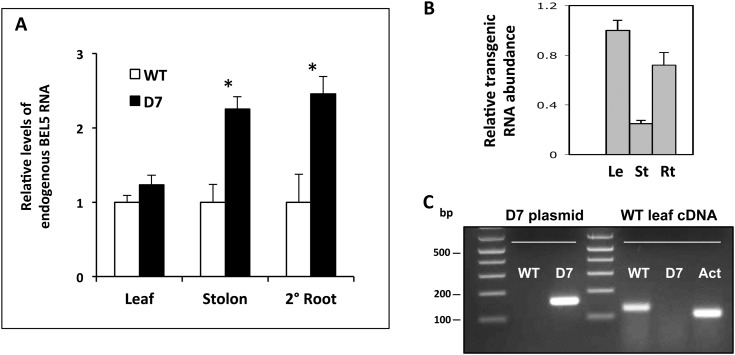
Figure 7.
Effect on endogenous levels of StBEL5 in transgenic plants that accumulate transgenic StBEL5 RNA in leaves, stolon tips, and lateral roots. A, Relative levels of endogenous StBEL5 transcript were quantified using total RNA extracted from new leaves (Leaf), 0.5-cm samples from the tip of tuberizing stolons (Stolon), and lateral roots (2° Root) of transgenic lines of andigena expressing the D7 construct (lacking the 5′ UTR sequence) of StBEL5 RNA driven by the GAS promoter of melon (black bars) or wild-type plants (WT; white bars). Asterisks indicate significant differences (P < 0.05) using Student’s t test. B, To assess the degree of mobility for transgenic StBEL5 RNA, relative levels of transgenic RNA were quantified in leaves (Le), stolon tips (St), and lateral roots (Rt) of the D7 line. All samples were harvested from plants growing under short days for 20 d. Using real-time qRT-PCR, an StBEL5 gene-specific primer plus either a primer for the NOS terminator sequence specific to all transgenic RNAs or an endogenous RNA-specific primer for the 5′ UTR of StBEL5 were used. Deletion of the 5′ UTR in the D7 construct made it possible for the primers to specifically amplify either endogenous (+5′ UTR; A) or transgenic (−5′ UTR; B) StBEL5 RNA. The expression of each target gene was normalized to endogenous reference genes StACT8 (A) or StUBQ (B). The fold change in expression of endogenous and transgenic StBEL5 transcripts in D7 tissue samples was calculated as the comparative threshold cycle method value relative to the mean values obtained in wild-type (A) or D7 (B) leaf control tissues. C, Specificity of the endogenous StBEL5 (wild type) and transgenic (D7) primers used was verified on a plasmid containing the D7 construct and wild-type leaf cDNA. Actin primers (Act) were used against the cDNA template as a PCR control. In RT-PCR using gene-specific primers for transgenic StBEL5 RNA, no PCR product was detected in any wild-type organs (Supplemental Fig. S2). se values of three biological replicate samples are shown.

