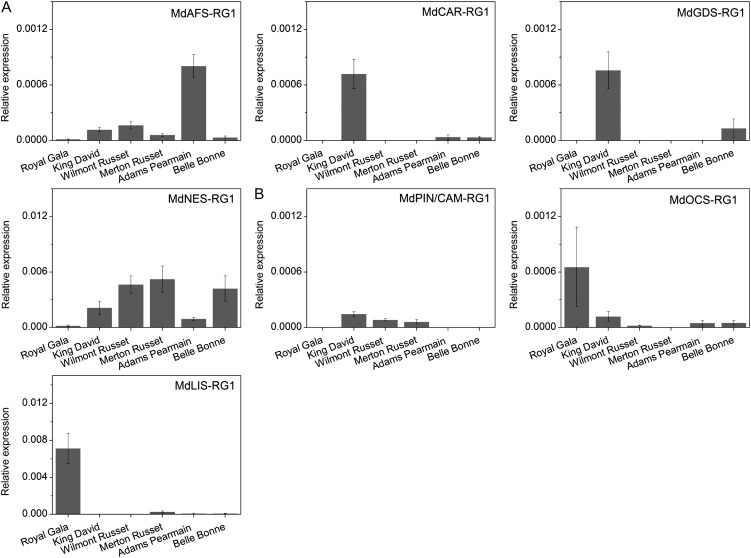
Figure 9.
TPS gene expression in the fruit of five heritage apple cultivars. Fruit were picked at approximately 150 DAA, and gene expression data analysis was carried out using the same conditions and primers as described in Figure 5. The expression of each TPS gene in cv Royal Gala fruit at 150 DAA from Figure 8 has been included for comparison. Data are presented as means ± se (n = 4).

