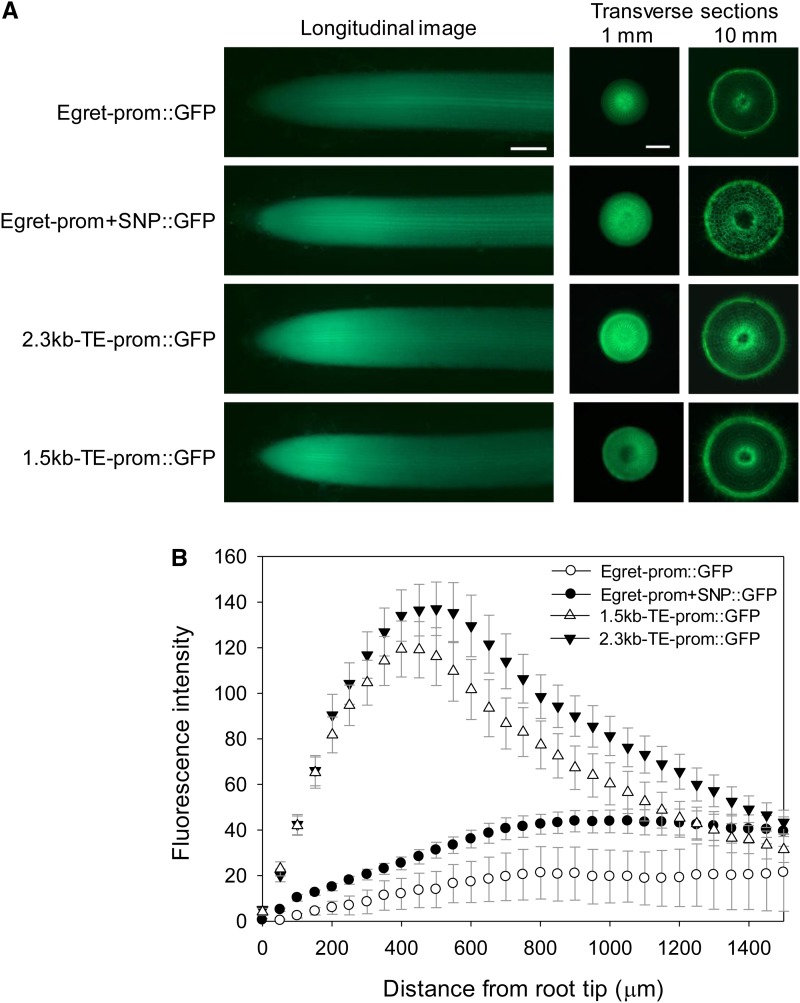
Figure 8.
Promoter regions (TE and SNP) that enhance the level of gene expression. A, Rice plants were transformed with 3 kb of the cv Egret promoter (Egret-prom::GFP), 3 kb of the cv Egret promoter incorporating the SNP present in cv Carazinho (Egret-prom+SNP::GFP), 2.3 kb of the cv Carazinho promoter that includes part of the TE (2.3kb-TE prom::GFP), and 1.5 kb of the cv Carazinho promoter that includes a shorter part of the TE (1.5kb-TE prom::GFP). The regions of the TaMATE1B promoters used to prepare the various constructs are shown in Figure 1. Shown are fluorescence images of representative longitudinal root sections (approximately 1.5 mm) and transverse root sections taken at 1 and 10 mm from the root apex as indicated. Due to large differences in absolute fluorescence, images were not taken with the same exposure settings. Bars = 200 µm. B, Quantification of fluorescence from longitudinal root images (1.5 mm) for the four promoter constructs. The symbols represent average levels of GFP intensity (arbitrary units) from eight to nine independently generated transgenic plants, and the error bars denote se.

