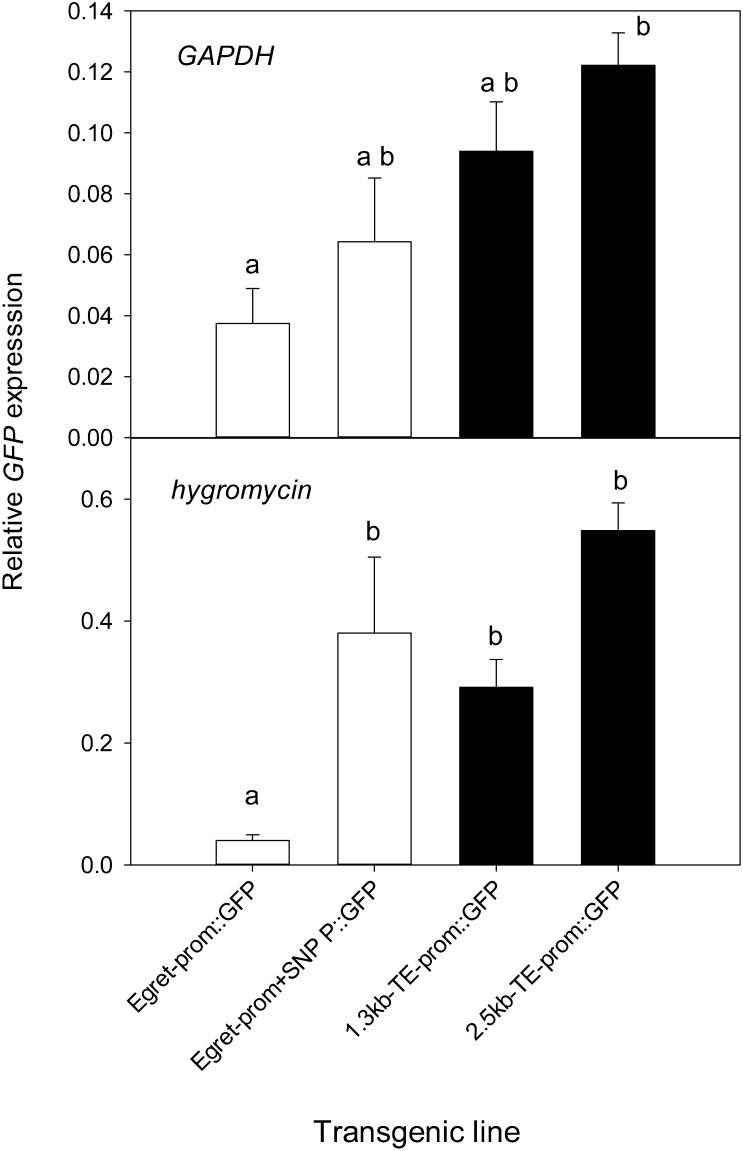
Figure 9.
Analysis of GFP expression in root apices (approximately 5 mm) of transgenic rice by qRT-PCR with GAPDH and Hygromycin as reference genes. Data show mean relative expression and se (n = 6–10). Since the data were either not normally distributed or had unequal variances, a Kruskal-Wallis ANOVA on ranks was undertaken and a pairwise comparison using Dunn’s method was applied. Constructs with different letters denote statistically significant differences (P < 0.05).

