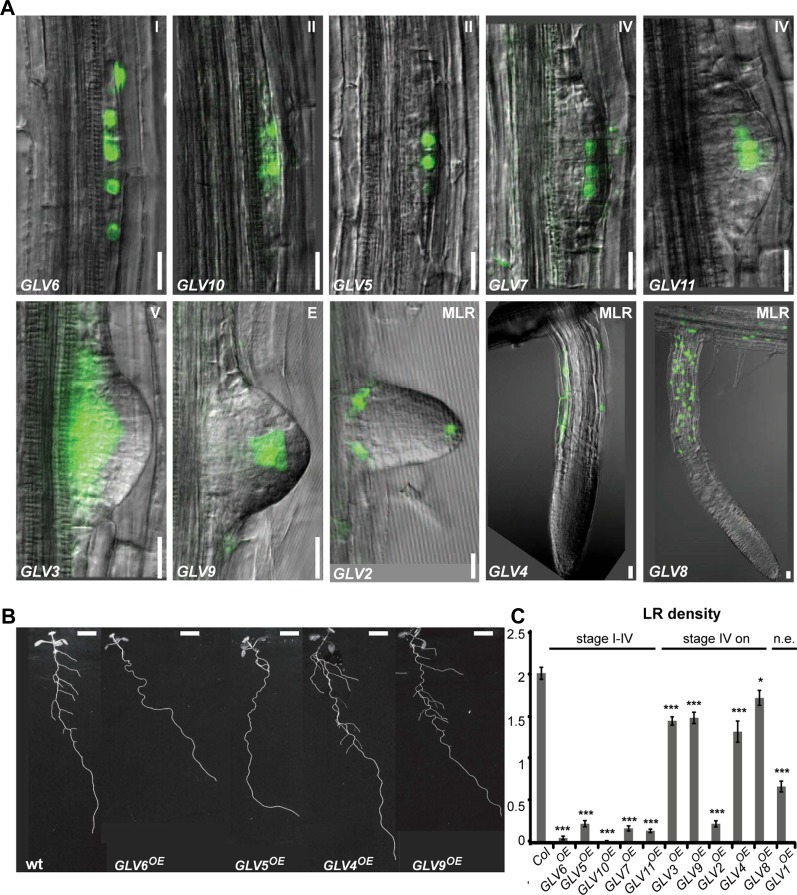
Figure 2.
Lateral root GLV expression and gof phenotype. A, First stage at which transcriptional activity is detected for each promoter. Corresponding developmental stages are indicated in the top right corner either as a number or a letter. E, Emerged LR; MLR, LR with established apical meristem. GLV1 expression was not detected in LRs (data not shown). B, LRs in wild-type (wt) and selected GLVOE plants at 12 dag. Bars = 20 μm (A) and 0.5 cm (B). C, Number of emerged LRs per 1 cm in GLVOE lines. GLV genes were organized according to their expression onset, from earliest to latest. Two categories are defined on top of the graph corresponding to GLV genes active before and after stage IV, respectively. Col, Columbia-0; n.e., not expressed in LRs. The chart shows data from two independent experiments ± se (n = 22–64). Stars indicate significant differences compared with the wild type (*P < 0.05, ***P < 0.001).

