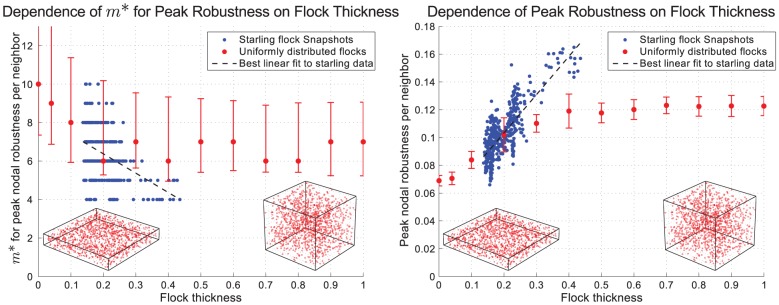
Figure 3. Dependence of the optimum number of neighbors (m*) and the peak value of robustness per neighbor on the thickness of the flock.

Flock thickness is defined as the ratio of smallest to largest dimension of an ellipsoid having the same principal moments of inertia as the flock. Results are shown in blue from each snapshot of starling data and in red from flocks randomly generated from a uniform distribution within a rectangular prism. Each data point shown from the random flocks is the average result from generating 100 separate flocks, each containing 1200 individuals. The error bars shown for peak values are the standard deviation, while the error bars for m* show the range of values for which the robustness per neighbor is within 90% of the peak. Under each plot are the positions of two randomly generated flocks, with thicknesses of 0.15 and 0.85.
