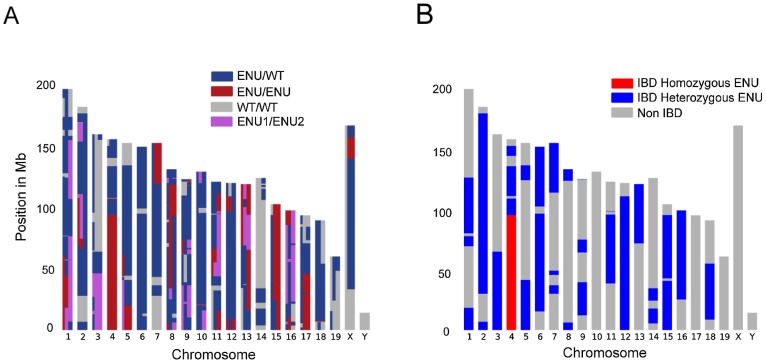
Figure 2. Identification of IBD Regions using a Modified Lander-Green Algorithm.
(A) Graphical representation of the output of the algorithm, showing the genotypes for the 3 mice, based on combinations of the 4 haplotypes ENU1, ENU2, WT1 and WT2 inherited from the founder mice. WT1 and WT2 are genetically indistinguishable. Each mouse is represented by a vertical third of the plot for each chromosome, and color blocks represent unphased haplotype combinations for each mouse as indicated in the figure. ENU/ENU indicates homozygous ENU regions and ENU/WT indicates heterozygous regions for ENU 1 or ENU 2. (B) Graphical representation of the chromosomal IBD regions, showing shared heterozygous (blue) and homozygous (red) IBD regions. Regions are only IBD if all mice share alleles from a particular ENU founder, ENU1 or ENU2. Non homozygous IBD regions in which all mice carry at least one matching ENU allele are considered IBD heterozygous.

