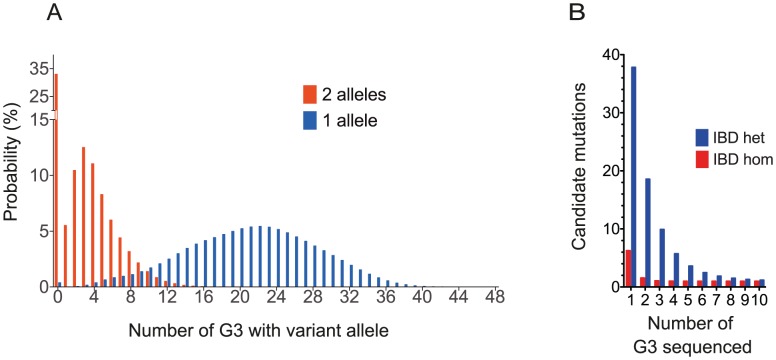
Figure 5. Modeling the Frequency of Mutants and the Power to Assign Causation by WGS.
(A) The frequency distribution for all mutations within a pedigree at the G3 level, based on a model pedigree of 48 G3 arising from 4 G2 pairs (Materials and Methods). In the specific case of mutations causing fully penetrant phenotypes, the histograms show the distribution of affected mice with recessive (2 allele) and dominant (1 allele) traits. (B) The number of IBD candidate mutations, defined as missense, stop or splice-variants, as a function of the number of sequenced affected G3 mice, based on our model.

