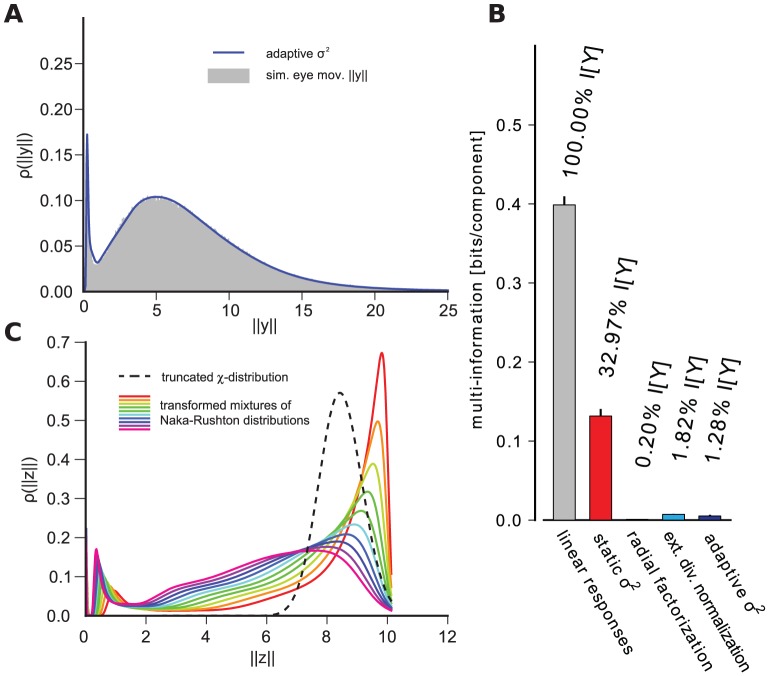
Figure 3. Radial distribution and redundancy reduction achieved by the dynamically adapting model.
A: Histogram of  for natural image patches sampled with simulated eye movements: The distribution predicted by the dynamically adapting model closely matches the empirical distribution. B: Same as in Fig. 1B but for simulated eye movement data. The dynamically adapting
  achieves an almost optimal redundancy reduction performance. C: Each colored line shows the distribution of a random variable from 3A transformed with a Naka-Rushton function. Different colors correspond to different values of
  . The dashed curve corresponds to a truncated
  -distribution. A mixture of the colored distributions cannot resemble the truncated
  -distribution since there will either be peaks on the left or the right of the dashed distribution that cannot be canceled by other mixture components.

