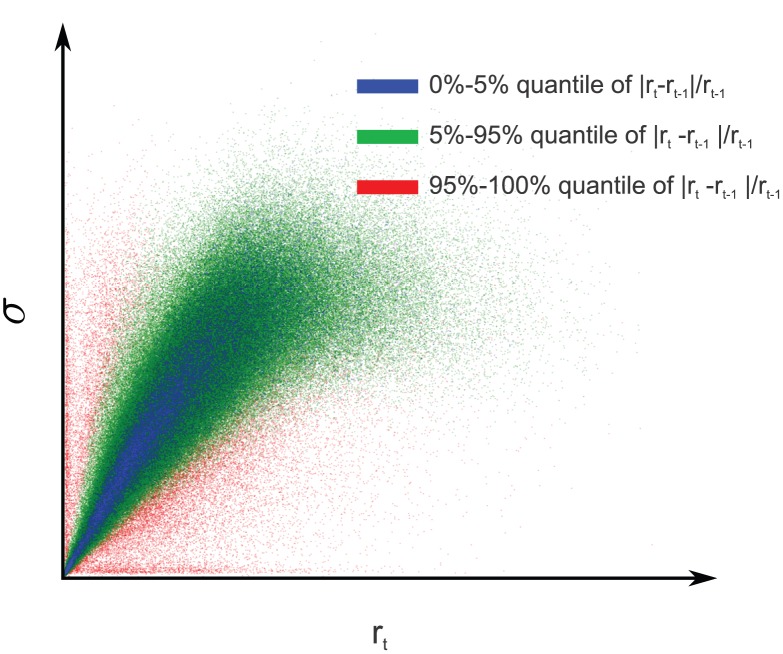
Figure 4. Dynamics of the adaptive  .
.
The scatter plot shows the values of  plotted against the
  used to transform
  in the dynamic divisive normalization model. The two values are clearly correlated. This indicates that the shift of the contrast response curve, which is controlled by
  , tracks the ambient contrast level, which is proportional to
  . Single elements in the plot are colored according to the quantile the value of
  falls in. When the ambient contrast level changes abruptly (e.g. when a saccade is made), this value is large. If the ambient contrast level is relatively stable (e.g. during fixation), this value is small. In those situations (blue dots),
  and
and  exhibit the strongest proportionality.

