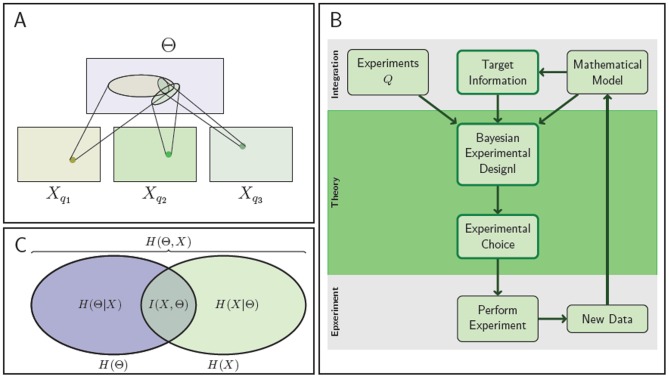
Figure 1. Information content of experimental data and flow chart of the experimental design method.
(A) The regions of plausible parameters values for three different experiments. Each ellipse defines the set of parameters which are commensurate with the output  of an experiment
  . In this example, the data
  leads to the most precise inference of the parameters. The parameters which explain the output of all the three experiments are at the intersection of the three ellipsoids. (B) Flowchart of the experimental design method. Given a mathematical model of the biological system, a set of experiments and the target information —which can be either a set of parameters to infer or a description of the experiment to predict — the Bayesian Experimental Design method determine the experiment to carry out. Once the experiment has been performed, the experimental data are then used to provide target information and to improve the model. Thereafter, the process can be iterated to select other experiments in order to improve the accuracy of the target information. (C) Link between the total and conditional entropies and the mutual information of experimental data
  and parameters
  .
.

