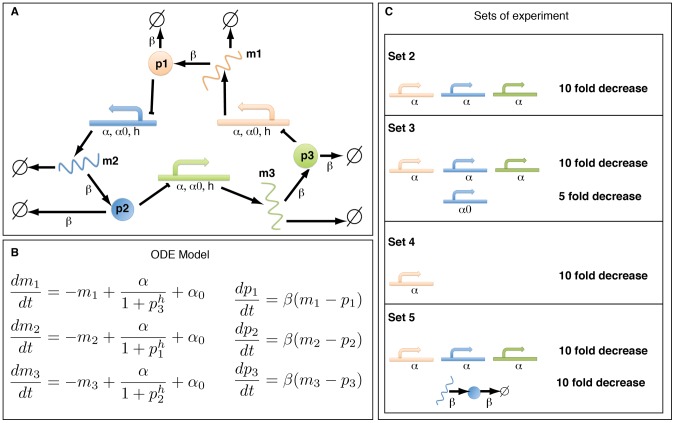
Figure 2. The repressilator model (as described in [40]) and the set of possible experiments.
(A) Illustration of the original repressilator model. The model consists of 3 mRNA species (coloured wavy lines, labeled  ,
,  and
and  ) and their corresponding proteins (circles shown in the same color with labels
  ,
,  and
and  ). The 3 regulatory DNA regions are not modeled explicitly but included in the mRNA production process. They are shown for illustration purpose only. (B) The ordinary differential equations which describe the evolution of the concentration of the mRNAs and proteins over time. (C) Four potential modifications of the wild-type model. For each experimental intervention the modified parameters are listed (colours are as in A). The modifications of the wild-type model consist of decreasing one or several of the parameters of the system: in sets
  ,
,  and
and  , the regime of the parameter
  is changed; in sets
  ,
,  and
and  , respectively, parameters
  ,
,  and
and  are modified for only one gene which breaks the symmetry of the system.

